
二次函数与线性函数的交点
几何画板及绘图内容加载中,请稍等……
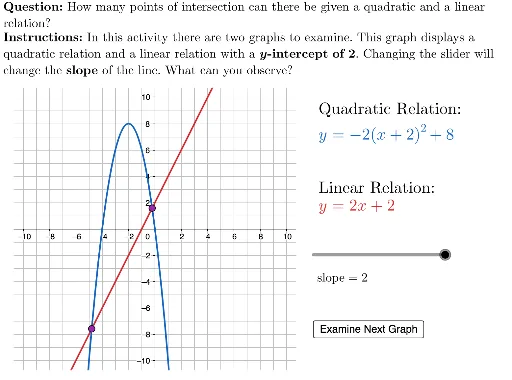
①本范例演示了二次函数与线性函数图像的交点及其动态变化;②涉及核心数学概念包括函数图像、交点求解、解析几何、微积分;③作图要点运用了LaTeX、If、Intersect、Polygon等GeoGebra命令,通过滑块和参数控制函数与交点的动态展示;④适合高中及以上数学教学,用于函数图像分析、交点计算及微积分初步教学。
GeoGebra 命令及参数
LaTeX("\textbf{Question: }How many points of intersection can there be given a quadratic and a linear\\relation?") → QUESTIONIf(isFirstGraph, "slope", "\(y\)-intercept") → changeIf(isFirstGraph, "\(y\)-intercept of 2", "slope of 2") → givenLaTeX((((("\textbf{Instructions: }In this activity there are two graphs to examine. This graph displays a\\quadratic relation and a linear relation with a \textbf{" * given) * "}. Changing the slider will\\change the \textbf{") * change) * "} of the line. What can you observe?")) → INSTRUCTIONSIntersect(firstQuadratic, firstLine) → A, BIntersect(secondQuadratic, secondLine) → C, DLaTeX((((("\text{" * QUESTION) * "\\") * INSTRUCTIONS) * "}")) → TEXTPolygon({(-10.75, -10.75), (-10.75, 10.75), (10.75, 10.75), (10.75, -10.75)}) → viewBox