
高中青蛙数量追踪GeoGebra范例
几何画板及绘图内容加载中,请稍等……
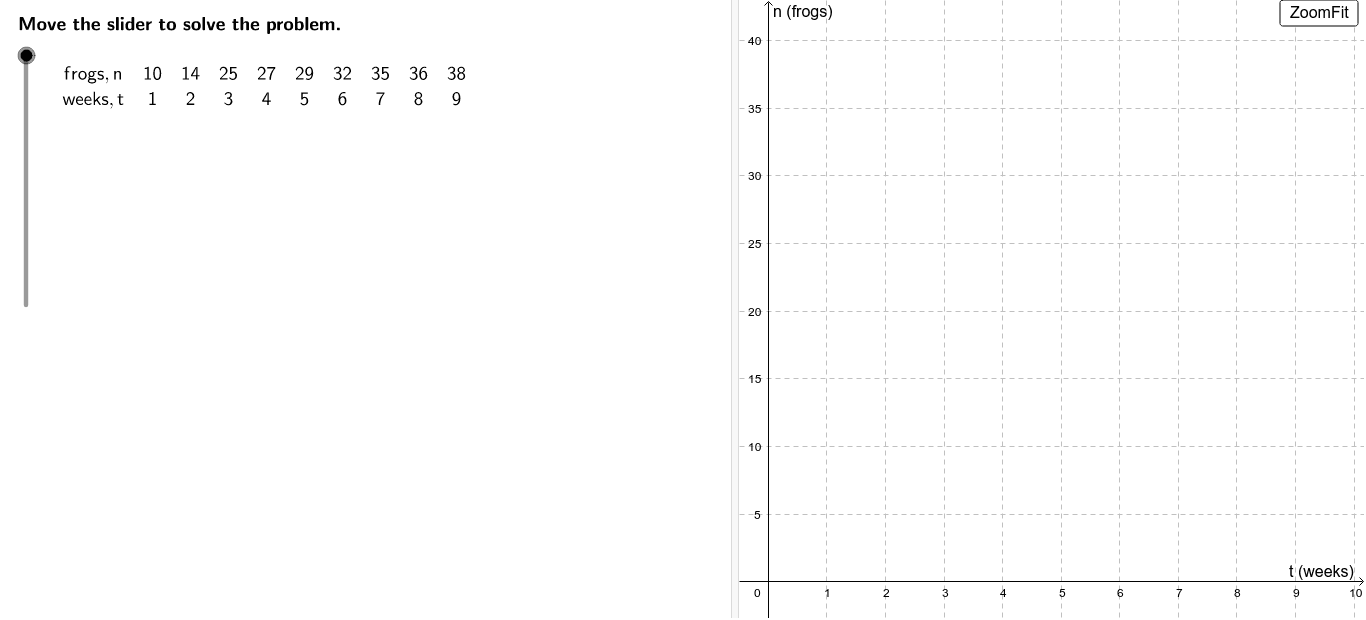
①本范例演示了如何使用GeoGebra追踪并可视化某校自然社团对一株红树林中树蛙数量的变化趋势;②涉及的核心数学概念包括数列、线性方程、数据拟合及统计分析;③通过构造摘要中提到的Length, LaTeX, Corner, TableText, Sequence, Fit, Sum, If等命令及对象,实现了数据的动态输入、处理与可视化;④适合高中阶段数学教学,用于展示数据建模与函数拟合的应用实例。
GeoGebra 命令及参数
Length(frogs) → numptsLaTeX(steps) → counterLaTeX("\text{Move the slider to solve the problem.}") → text0Corner(1) → ACorner(3) → BTableText({{"frogs,n", Element[frogs, 1], Element[frogs, 2], Element[frogs, 3], Element[frogs, 4], Element[frogs, 5], Element[frogs, 6], Element[frogs, 7], Element[frogs, 8], Element[frogs, 9]}, {"weeks,t", 1, 2, 3, 4, 5, 6, 7, 8, 9}}, "c") → tableLaTeX(table) → ProblemLaTeX("\text{Create a scatter plot of the table values.}") → text1Sequence((i, Element[frogs, i]), i, 1, numpts) → plotFit(plot, (a * b^(x))) → fFit(plot, (c * x^(d))) → gLaTeX(g, true, true) → text6LaTeX("\text{Which function fits the data best?}") → text7Sequence((Element[frogs, i] - f(i))^(2), i, 1, numpts) → fdiffsSequence((Element[frogs, i] - g(i))^(2), i, 1, Length[frogs]) → gdiffsSum(fdiffs) → fmsSum(gdiffs) → gmsLaTeX("\text{Fit an exponential function of the form }\textcolor{#006633}{f(x) = a b^x}\text{ to the data.}") → text3LaTeX("\text{Fit a power function of the form }\textcolor{#CC0000}{g(x) = c x^d}\text{ to the data.}") → text5LaTeX("\text{Does the shape of the function look similar to the shape of the data}\cr\text{or does the function appear to be headed off in a different direction}\cr\text{from the data?}") → text8LaTeX("\text{Is one function consistently closer to the individual data points than the other?}") → text10LaTeX("\text{Do the functions do anything obviously unreasonable if they are used }\cr\text{to predict values {outside the range of collected data?}") → text12LaTeX("\text{Neither function does this. We know in general that exponential }\cr\text{growth cannot occur indefinitely, but that it does occur temporarily.}") → text13LaTeX("\text{Use the buttons below to return to the original problem or}\cr\text{randomly generate a similar practice problem.}") → RandomizationTextIf(angleMargin < (-0.2), LaTeX["\text{The }\textcolor{#006633}{exponential} \text{ function does better with this.}"], If[angleMargin > 0.2, LaTeX["\text{The }\textcolor{#CC0000}{power}\text{ function does better with this.}"], LaTeX["\text{The functions are similar in this respect.}"]]) → text9If(margin < (-0.2), LaTeX["\text{The }\textcolor{#006633}{exponential}\text{ function does better with this.}"], If[margin > 0.2, LaTeX["\text{The }\textcolor{#CC0000}{power}\text{ function does better with this.}"], LaTeX["\text{The functions are similar in this respect.}"]]) → text11LaTeX("\text{Data points should not be connected by any lines.}") → text2LaTeX((("\textcolor{#006633}{f(x)=" * f) * "} \text{ Note: functions may vary.}")) → text4Length(frogs_1) → numpts_1Sequence((i, Element[frogs_1, i]), i, 1, numpts_1) → plot_1Fit(plot_1, (a * b^(x))) → f_1LaTeX("\text{ Note: functions may vary.}") → text4_1
AI 绘图提示语参考
绘制一个高中青蛙种群追踪图表,展示9周内树蛙数量变化。包含一个散点图显示实际数据,以及两个拟合曲线(指数函数和幂函数),比较它们与数据的拟合程度。图表应包含数据表格、文字说明和两个函数表达式,以分析哪种函数更适合描述种群增长趋势。
以上提示语为根据原始绘图命令整理而来,仅供参考。