
绘制正弦和余弦函数图像
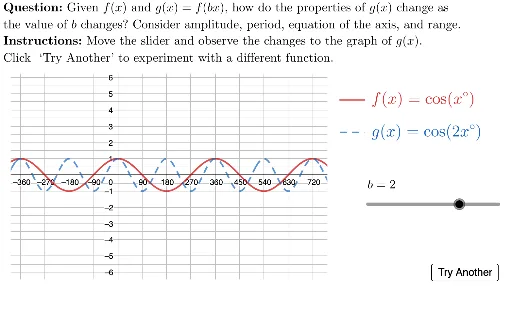
几何画板及绘图内容加载中,请稍等……
这个范例演示了如何使用 GeoGebra 绘制正弦和余弦函数的图像。涉及的核心数学概念包括三角函数、函数图像、对称性和变换。作图要点使用了 GeoGebra 命令如 UnicodeToLetter、Polygon、LaTeX、Segment、Translate,以及对象如 HowDidIDo、TryAnother、xmark、cmark、incorrect、correct、isDone、bottomLeft、topRight、viewbox、showFeedback、b、f、isSinFunc、k、g、h、lblB、lblCos、lblCosBx、lblSin、lblSinBx、MainInstruc、SpecInstruc、legendAnchor1、legendSegment1、legendSegment2。适合高中阶段学习三角函数和函数图像的学生使用。
GeoGebra 命令及参数
UnicodeToLetter(10007) → xmarkUnicodeToLetter(10003) → cmarkPolygon({bottomLeft, (x(bottomLeft), y(topRight)), topRight, (x(topRight), y(bottomLeft))}) → viewboxLaTeX(("b=" * b)) → lblBLaTeX("f(x)=\cos(x°)") → lblCosLaTeX((("g(x)=\cos(" * b) * "x°)")) → lblCosBxLaTeX("f(x)=\sin(x°)") → lblSinLaTeX((("g(x)=\sin(" * b) * "x°)")) → lblSinBxLaTeX("\text{\textbf{Question: }Given \(f(x)\) and \(g(x)=f(bx)\), how do the properties of \(g(x)\) change as \\the value of \(b\) changes? Consider amplitude, period, equation of the axis, and range. }") → MainInstrucLaTeX("\text{\textbf{Instructions: }Move the slider and observe the changes to the graph of \(g(x)\).\\Click `Try Another' to experiment with a different function. ") → SpecInstrucSegment(legendAnchor1, legendAnchor1 + (90, 0)) → legendSegment1Translate(legendSegment1, (0, -2)) → legendSegment2