
探索指数函数图像
几何画板及绘图内容加载中,请稍等……
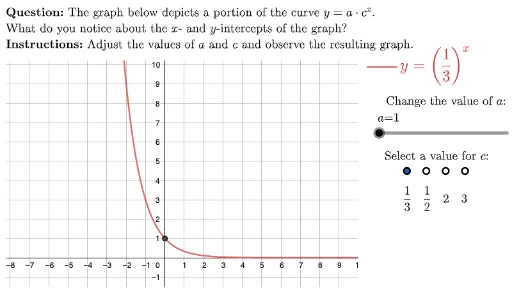
①本范例演示指数函数图像随底数变化的动态特性;②涉及核心数学概念包括指数函数、函数图像变换、导数;③构造要点运用了GeoGebra命令如UnicodeToLetter、Polygon、TableText、LaTeX、Intersect、Sequence、Element、Segment等,以及对象如right、left、bottom、top、HowDidIDo、TryAnother、xmark、cmark等;④适合高中及以上数学学习者,用于理解指数函数性质及图像绘制技巧。
GeoGebra 命令及参数
UnicodeToLetter(10007) → xmarkUnicodeToLetter(10003) → cmarkPolygon({(left, bottom), (left, top), (right, top), (right, bottom)}) → viewboxTableText({rbDisplay}) → rbLabelsLaTeX(If[a ≟ 1, If[currBaseIndx < 3, (("y=\left(" * Element[rbDisplay, currBaseIndx]) * "\right)^x"), (("y= \vphantom{\dfrac{1}{1}^2}" * Element[rbDisplay, currBaseIndx]) * "^x")], (((("y= \vphantom{\dfrac{1}{1}^2}" * a) * "\left(") * Element[rbDisplay, currBaseIndx]) * "\right)^x")]) → eqnDispLaTeX("The graph below depicts a portion of the curve \(y=a\cdot c^x\).\\What do you notice about the \(x\)- and \(y\)-intercepts of the graph?") → MainInstrucLaTeX("Adjust the values of \(a\) and \(c\) and observe the resulting graph.") → SpecInstrucIntersect(f, yAxis, (0, 1)) → yInterceptSequence((11.5 + i, 4.5), i, 1, 4) → rbPointsElement(rbPoints, 1) → rb1Element(rbPoints, 2) → rb2Element(rbPoints, 3) → rb3Element(rbPoints, 4) → rb4Element(rbPoints, currBaseIndx) → currBaseLaTeX((((("\text{\textbf{Question: }" * MainInstruc) * "\\\textbf{Instructions: }") * SpecInstruc) * "}")) → allInstrucSegment(legendAnchor, legendAnchor + (1.5, 0)) → legendF