
置信区间计算演示
几何画板及绘图内容加载中,请稍等……
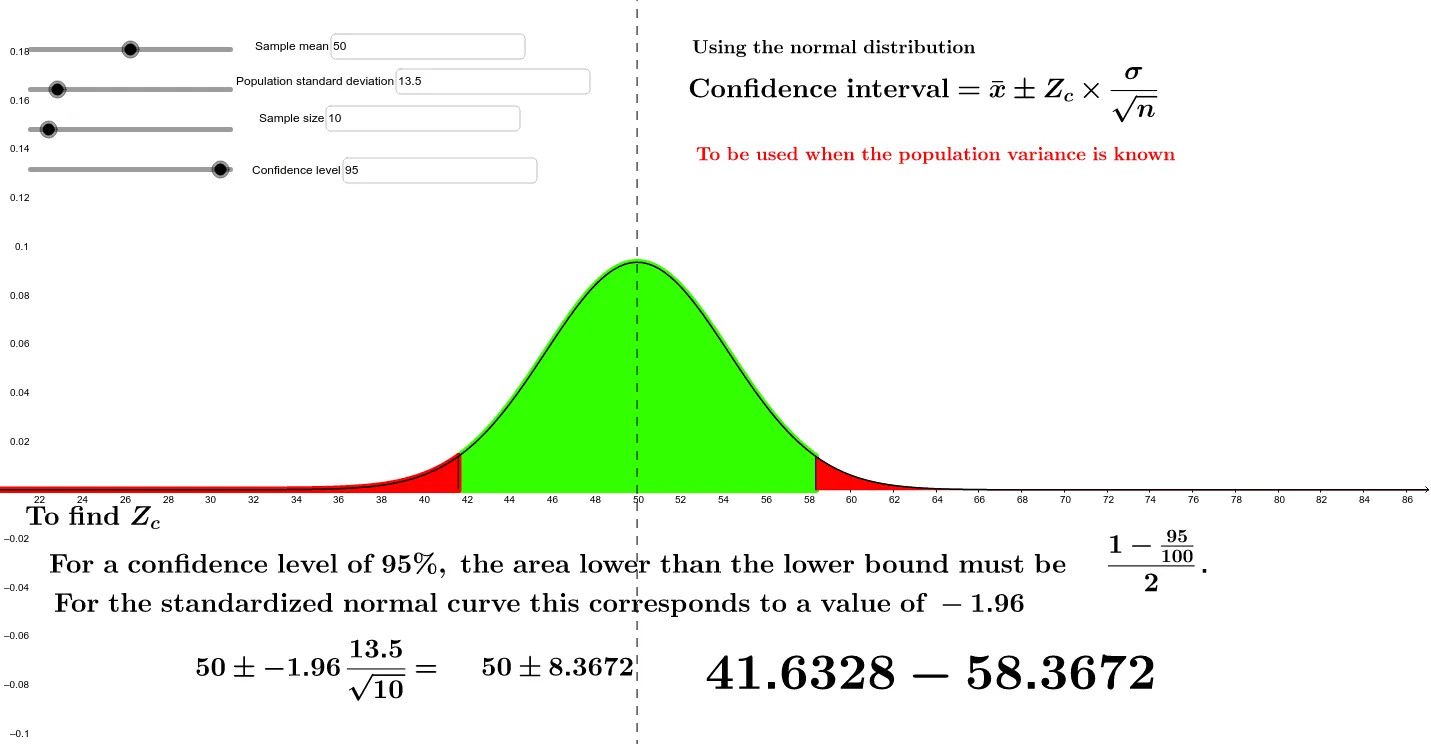
①本范例演示了如何使用 GeoGebra 计算并可视化置信区间;②涉及核心数学概念包括:正态分布、逆正态分布、积分、矩阵运算、正交中心、等腰三角形;③作图要点:使用了 Normal, InverseNormal, Integral, Segment, Textfield 等命令,以及样本均值、总体标准差、样本大小、置信度等对象;④适合高中及以上学生学习和理解概率统计中的置信区间概念。
GeoGebra 命令及参数
Normal(samplemean, populationsd / samplesize^(0.5), x) → fInverseNormal(0, 1, (1 - (0.01 * confidence)) / 2) → bIntegral(f, x(B), x(A)) → eIntegral(f, -1.0E99, x(B)) → gIntegral(f, x(A), 1.0E99) → hSegment(A, D) → cSegment(B, C) → dTextfield(samplemean) → inputBox1Textfield(populationsd) → inputBox2Textfield(samplesize) → inputBox3Textfield(confidence) → inputBox4