
正态分布与错误类型演示
几何画板及绘图内容加载中,请稍等……
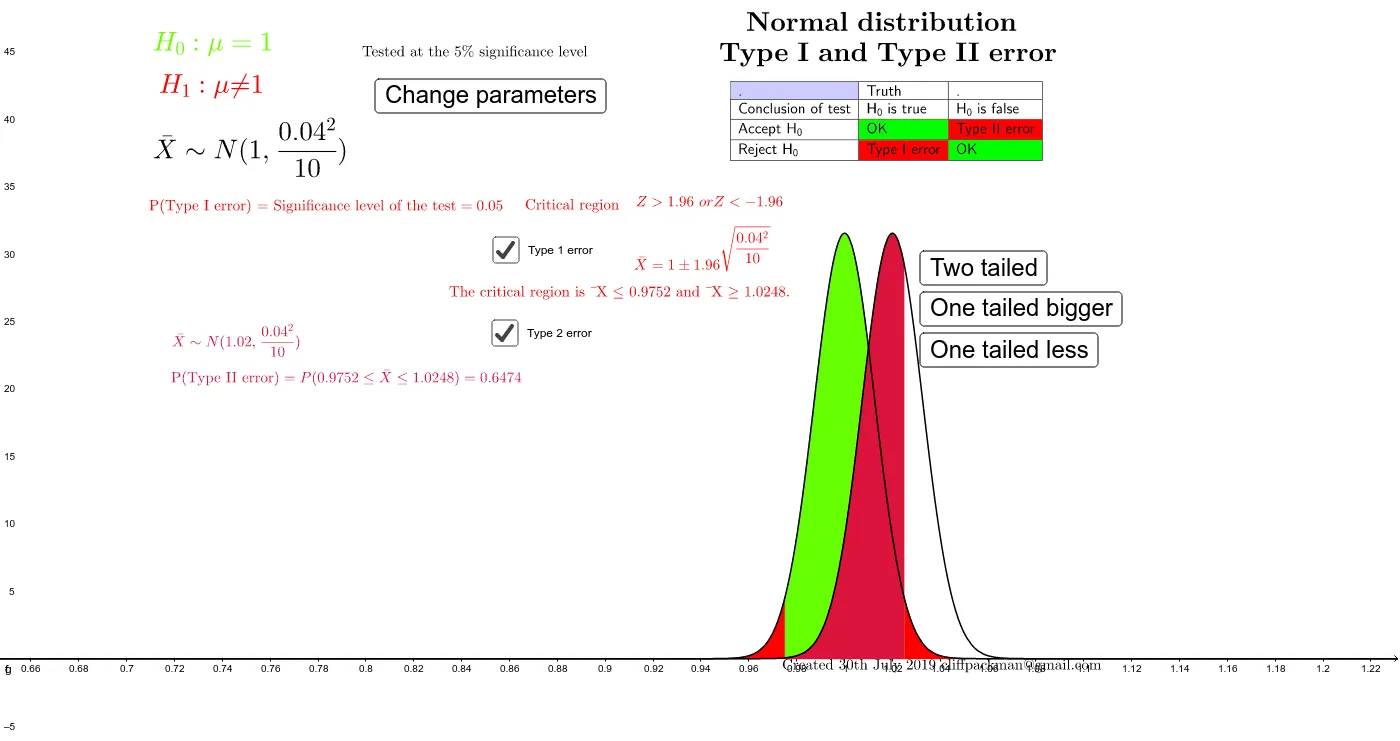
①本范例演示正态分布下假设检验中第一类和第二类错误的图形化解释;②涉及核心数学概念包括正态分布、显著性水平、错误类型、积分计算;③作图要点提炼自构造摘要,使用了TableText, InverseNormal, Normal, Integral等GeoGebra命令与对象;④适合高中及以上学生及需要深入理解统计推断的教师使用。
GeoGebra 命令及参数
TableText({{B1, C1, D1}, {B2, C2, D2}, {B3, C3, D3}, {B4, C4, D4}}, "|_") → text2InverseNormal(0, 1, 1 - tailedtailed) → zvalueNormal(assumednewmean, (stdeviation^(2) / samplesize)^(0.5), Lowerbound) → a_1Normal(assumednewmean, (stdeviation^(2) / samplesize)^(0.5), upperbound) → a_3Normal(mean, (stdeviation^(2) / samplesize)^(0.5), x) → fIntegral(f, -1.0E99, Lowerbound) → aIntegral(f, upperbound, 1.0E99) → bIntegral(f, Lowerbound, upperbound) → cNormal(assumednewmean, (stdeviation^(2) / samplesize)^(0.5), x) → gIntegral(g, Lowerbound, upperbound) → eInverseNormal(0, 1, 1 - significancelevel) → zvalue1Integral(f, Greaterupperbound, 1.0E99) → iIntegral(f, -1.0E99, Greaterupperbound) → jIntegral(g, -1.0E99, Greaterupperbound) → kNormal(assumednewmean, (stdeviation^(2) / samplesize)^(0.5), Greaterupperbound) → a_5Integral(f, -1.0E99, Lessthanlowerbound) → lIntegral(f, Lessthanlowerbound, 1.0E99) → mIntegral(g, Lessthanlowerbound, 1.0E99) → n