
班级规模与标准化考试成绩关系分析
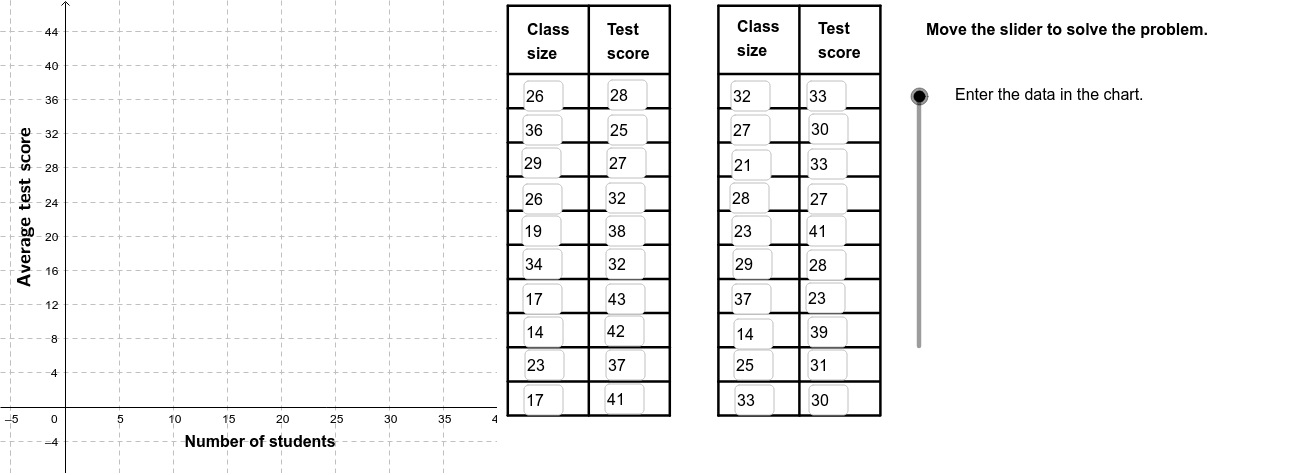
几何画板及绘图内容加载中,请稍等……
①本范例演示了如何通过散点图分析班级规模与标准化考试成绩之间的关系;②涉及的核心数学概念包括相关性(PMCC)、线性回归(FitLineY)、数据可视化(Scatter Plot);③作图要点提炼自构造摘要,使用了FitLineY命令进行线性拟合,PMCC计算相关系数,Textfield显示文本信息,If条件判断,Polygon创建多边形,Sequence生成序列,Segment绘制线段,RotateText旋转文本;④适合高中阶段数学教学,用于统计学和数据分析入门。
GeoGebra 命令及参数
FitLineY(PointList1) → LineFitPMCC(PointList1) → CorCoeffTextfield(A2) → InA2Textfield(A3) → InA3Textfield(A4) → InA4Textfield(A5) → InA5Textfield(A6) → InA6Textfield(A7) → InA7Textfield(A8) → InA8Textfield(A9) → InA9Textfield(A10) → InA10Textfield(A11) → InA11Textfield(A12) → InA12Textfield(A13) → InA13Textfield(A14) → InA14Textfield(A15) → InA15Textfield(A16) → InA16Textfield(A17) → InA17Textfield(A18) → InA18Textfield(A19) → InA19Textfield(A20) → InA20Textfield(A21) → InA21Textfield(B2) → InB2Textfield(B3) → InB3Textfield(B4) → InB4Textfield(B5) → InB5Textfield(B6) → InB6Textfield(B7) → InB7Textfield(B8) → InB8Textfield(B9) → InB9Textfield(B10) → InB10Textfield(B11) → InB11Textfield(B12) → InB12Textfield(B13) → InB13Textfield(B14) → InB14Textfield(B15) → InB15Textfield(B16) → InB16Textfield(B17) → InB17Textfield(B18) → InB18Textfield(B19) → InB19Textfield(B20) → InB20Textfield(B21) → InB21If(CorVisible, "Hide Correlation Coefficient", "Show Correlation Coefficient") → CorButtonIf(LineVisible, "Hide Best Fit Line", "Show Best Fit Line") → LineButtonPolygon((40, y(Corner[1])), Corner[2], Corner[3], (40, y(Corner[4]))) → poly1, a, b, c, dSequence(Segment[(41, -1 + (4 * i)), (56, -1 + (4 * i))], i, 0, 10) → Linesh1Sequence(Segment[(41 + (7.5 * i), -1), (41 + (7.5 * i), 47)], i, 0, 2) → Linesv1Sequence(Segment[(60.5 + (7.5 * i), -1), (60.5 + (7.5 * i), 47)], i, 0, 2) → Linesv2Sequence(Segment[(60.5, -1 + (4 * i)), (75.4, -1 + (4 * i))], i, 0, 10) → Linesh2Segment((41, 47), (56, 47)) → top1Segment((60.5, 47), (75.5, 47)) → top2RotateText("Average test score", 90*°) → SideLegend
AI 绘图提示语参考
绘制一个散点图,展示班级规模与标准化考试分数之间的关系。首先绘制散点图,然后添加最佳拟合直线和相关系数。使用文本框显示相关系数和直线方程。通过点击按钮切换显示或隐藏相关系数和直线。最后,添加网格线和坐标轴标签,使图表更清晰。
以上提示语为根据原始绘图命令整理而来,仅供参考。