
Draw with Natural Language
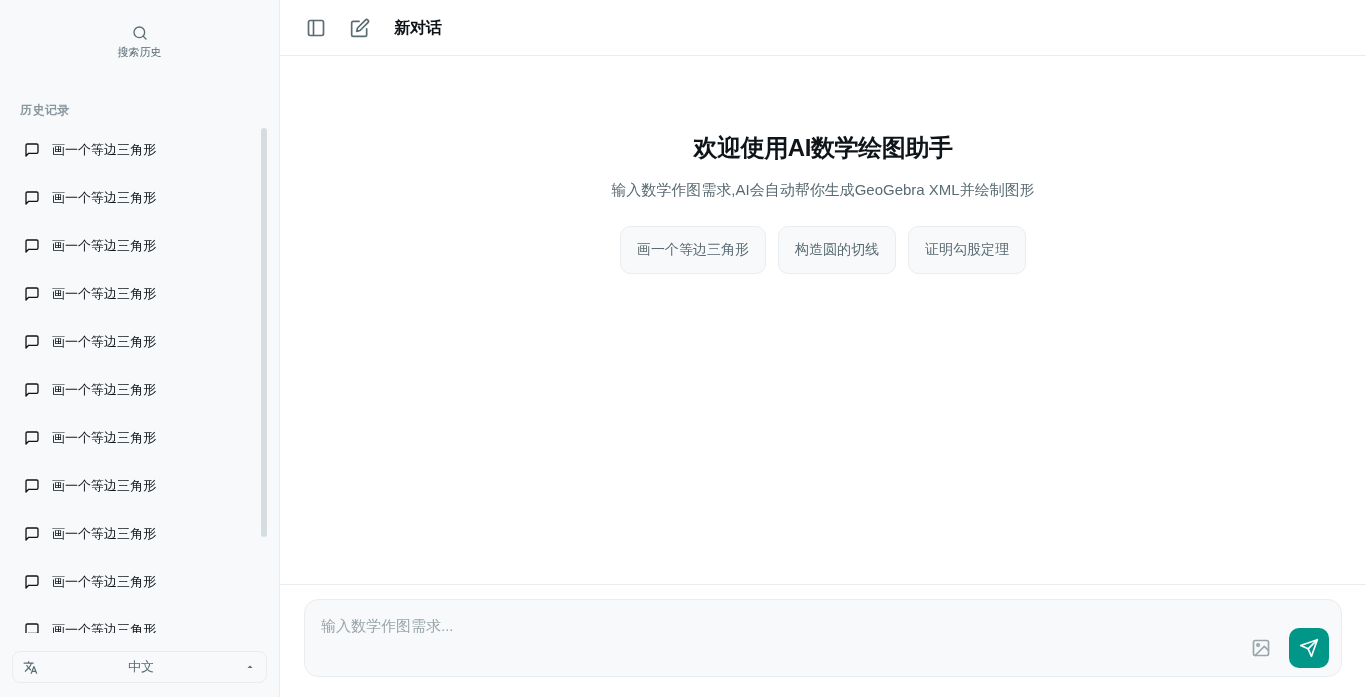
The canvas is the core of the platform: describe the figure in a sentence and the AI generates GeoGebra commands and renders them live.
Start drawing
- Open the canvas.
- Describe the figure, e.g. "draw a circle of radius 2 and mark its center" or "plot y = sin(x)".
- Send it; the AI returns GeoGebra XML and renders it on the board. Complex figures are planned in steps first (see Complex Figures & Step Drawing).
- Drag points and slide parameters on the board to watch the figure change.
Tips
- The more specific the description (coordinates, ranges, labels), the better the result.
- Functions, geometry, 3D and animated sliders are all supported.
- Ask for changes in the same conversation, or roll back in history.