
Z-tests, Distributions, and Statistics
Loading the math board and drawing, please wait…
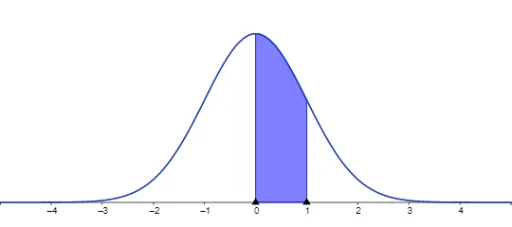
This example demonstrates how to conduct a Z-Test of a Mean graphically. Core math concepts include normal distribution, mean, standard deviation, and Z-score calculation. Construction highlights involve plotting the normal distribution curve, marking the mean and Z-scores, and dynamically adjusting parameters to observe results. Suitable for high school students and beginners in statistics.