
Power of a Power Rule
Loading the math board and drawing, please wait…
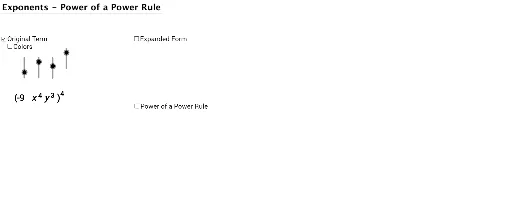
This example demonstrates the power of a power rule, (a^m)^n = a^(m*n). It uses GeoGebra commands to construct and understand this rule. Main commands used include Text, If, Translate, Sequence, etc. Suitable for middle school and above students to learn about exponent operations.
GeoGebra Commands & Parameters
Text("y") → text6Text("x") → text5Text(expX1 + "") → text8Text(expY1 + "") → text10If(color, 255, 0) → factorColor255If(color, 153, 0) → factorColor153Translate((6.923609046978582, -1.782455570499752), Vector[(0, 0), (0, -3)]) → ATranslate((6.923609046978582, 0.217544429500248), Vector[(0, 0), (0, -3)]) → BTranslate((7.524258469913336, 0.217544429500248), Vector[(0, 0), (0, -3)]) → CTranslate((7.524258469913336, -1.782455570499752), Vector[(0, 0), (0, -3)]) → DSequence(Translate[If[expY1 ≟ 1, y1, If[expY1 ≟ 2, y2, If[expY1 ≟ 3, y3, If[expY1 ≟ 4, y4, y5]]]], Vector[(0, 0), ((0.7 * i), 0)]], i, 0, exp - 1) → ExpandYSequence(Translate[If[expX1 ≟ 1, x1, If[expX1 ≟ 2, x2, If[expX1 ≟ 3, x3, If[expX1 ≟ 4, x4, x5]]]], Vector[(0, 0), ((0.7 * i), 0)]], i, 0, exp - 1) → ExpandX
AI Drawing Prompt Reference
Create a visual representation of the power of a power rule, showing (a^m)^n = a^(m*n) with coordinate axes and text labels. Use differently colored points and lines to illustrate the relationship, starting with basic axes and variable labels, then generate corresponding points based on exponent values, and demonstrate the power of a power process through translation and connection, forming a clear geometric construction display.
The prompt above was compiled from the original drawing commands and is for reference only.