
z-Scores Interactive Demonstration
Loading the math board and drawing, please wait…
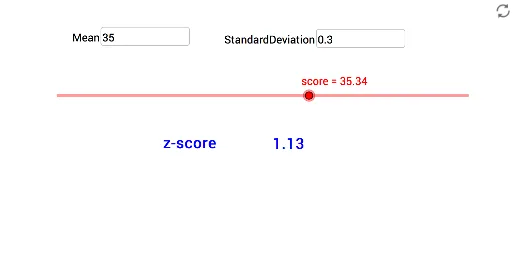
This GeoGebra example demonstrates the calculation and visualization of z-scores (standard scores), a fundamental concept in statistics that measures how many standard deviations a data point is from the mean. The formula z = (x - μ) / σ is implemented, where μ is the mean and σ is the standard deviation. Users can input the raw score and standard deviation via two input boxes (InputBox1, InputBox2), and the applet automatically computes and displays the z-score (zee) using text objects (text1, text2) and a text field (Textfield). The construction relies on GeoGebra commands such as Textfield and Text, along with variables mean, stdev, score, and zee to store inputs and perform the standardization. This interactive tool is ideal for high school or introductory college statistics courses, helping learners grasp how standardization enables comparison across different distributions. It serves as a hands-on resource for classroom demonstrations or self-study in probability and statistics.
GeoGebra Commands & Parameters
Textfield(mean) → InputBox1Textfield(stdev) → InputBox2Text(zee) → text1
AI Drawing Prompt Reference
Draw a normal distribution curve where users can input the raw score and standard deviation to calculate and display the z-score. First, create input fields for the user to enter the mean and standard deviation, then calculate the z-score based on the inputs and display the result on the graph.
The prompt above was compiled from the original drawing commands and is for reference only.