
Z-Scores as Geometric Transformations
Loading the math board and drawing, please wait…
In collections
A Geometry Teacher Meets the Correlation Coefficient
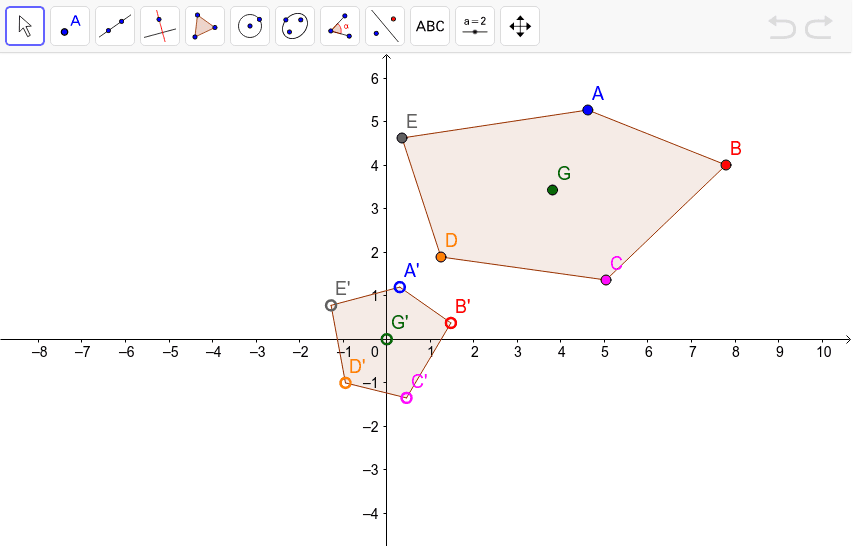
This example demonstrates how standardizing coordinates can be viewed as a geometric transformation, exploring angle measures and areas and perimeters. Using GeoGebra commands like PMCC, LaTeX, FitLineY, FitLineX, Point, Angle, Slope, Polygon, it visually illustrates the geometric meaning of z-scores, involving core mathematical concepts such as z-scores, geometric transformations, coordinate geometry, and normal distribution. Key construction steps include creating points, measuring angles, fitting lines, and calculating slopes. Suitable for high school students and teachers to deeply understand the geometric applications of z-scores.
GeoGebra Commands & Parameters
PMCC({A, B, C, D, E}) → rLaTeX(r, true, true) → text1FitLineY({A', B', C', D', E'}) → cFitLineX({A', B', C', D', E'}) → dPoint(d) → KPoint(c) → LAngle(K, (0, 0), L) → αFitLineY({A, B, C, D, E}) → eSlope(e) → mFitLineY({M, N, O, P, Q}) → hSlope(h) → m_1Slope(c) → m_2FitLineY({A', B', C', D', E'}) → gSlope(g) → m_3Polygon(A, B, C, D, E) → poly1, a_1, b_1, c_1, d_1, e_1Polygon(A', B', C', D', E') → poly2, a', b', c', d', e'
AI Drawing Prompt Reference
Create five original data points and their standardized counterparts, then draw regression lines through each set of points to visualize the linear relationships. Mark the intersection of these two lines and measure the angle formed by the intersection, the origin, and a reference point. Compute the slopes of the lines and use them to illustrate the transformation. Finally, draw polygons connecting the original points and the standardized points separately, showing how z‑scores act as geometric transformations that affect position, orientation, and size.
The prompt above was compiled from the original drawing commands and is for reference only.