
Writing Polynomial Functions from their Graphs
Loading the math board and drawing, please wait…
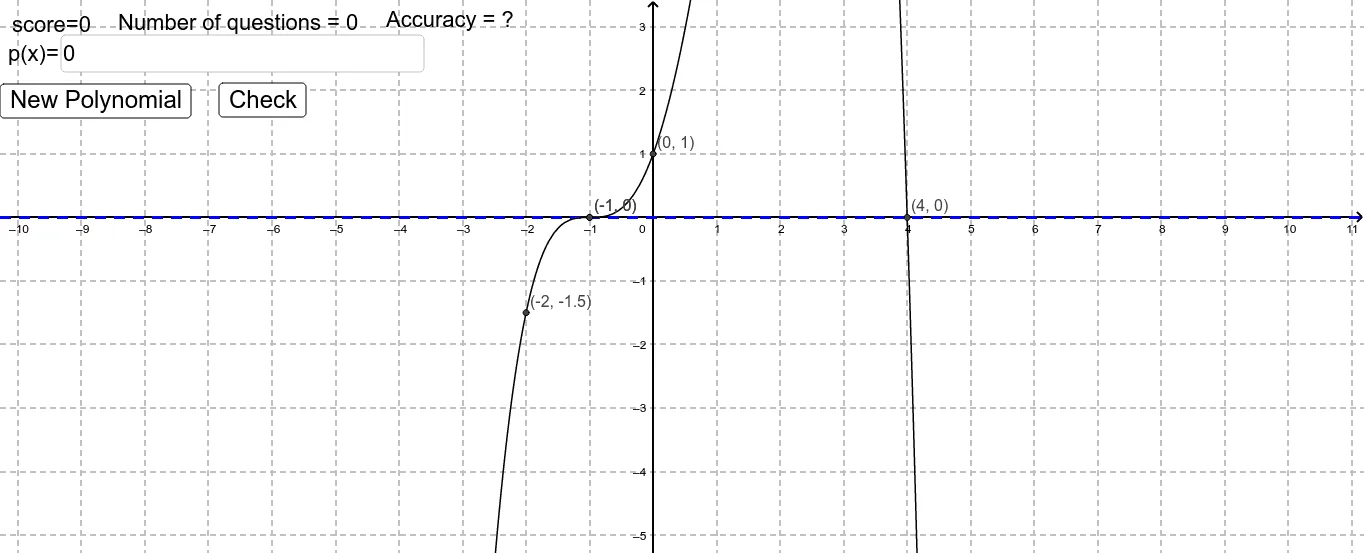
This example demonstrates how to write polynomial function expressions based on given graphs. The math concepts involved include the properties of polynomial functions, the relationship between graph features and function expressions. Construction highlights: Using GeoGebra commands/objects like RandomElement, Random, Text, Textfield; objects: a, b, c, r1, r2, r3, f, p, samegraph, A, B, C, D, E, F, G, R1, R2, R3, correct, Incorrect, score, text1, inputBox1, button1, button2, check, problems, accu, questions, accur. Suitable for high school mathematics, teaching and practice on polynomial function graphs and expressions.
GeoGebra Commands & Parameters
RandomElement({-2, -1.5, -1, -0.5, -0.3333333333333333, -0.25, 0.25, 0.3333333333333333, 0.5, 1, 1.5, 2}) → aRandomElement({0, 1, 2, 3}) → bRandomElement({0, 1, 2}) → cRandom(-6, 6) → r1Random(-6, 6) → r2Random(-6, 6) → r3Text(("score=" * score)) → text1Textfield(f) → inputBox1Text(("Number of questions = " * problems)) → questionsText(("Accuracy = " * accu)) → accur
AI Drawing Prompt Reference
Draw a polynomial function expression based on given graphs. The graph includes random coefficients a, b, c, and random points r1, r2, r3. The construction order starts with coefficients, then points, and finally the function expression. Ensure the graph clearly shows the features of the polynomial function.
The prompt above was compiled from the original drawing commands and is for reference only.