
Writing Polynomial Functions from their Graphs by David
Loading the math board and drawing, please wait…
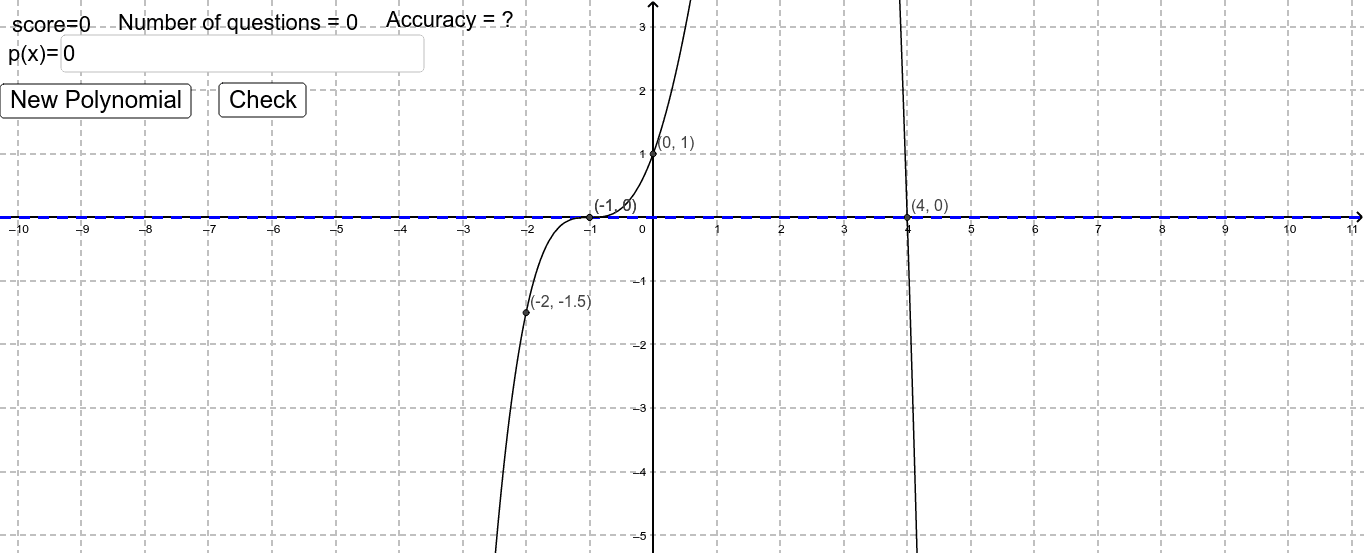
This example demonstrates how to derive polynomial functions from given graphs, focusing on quadratic equations and geometric constructions. Key mathematical concepts include function graphs, quadratic equations, and geometric transformations. The construction involves using GeoGebra commands such as RandomElement, Random, Text, and Textfield to create and analyze graphs. It is suitable for high school students or college freshmen to understand the relationship between polynomial functions and geometric shapes.
GeoGebra Commands & Parameters
RandomElement({-2, -1.5, -1, -0.5, -0.3333333333333333, -0.25, 0.25, 0.3333333333333333, 0.5, 1, 1.5, 2}) → aRandomElement({0, 1, 2, 3}) → bRandomElement({0, 1, 2}) → cRandom(-6, 6) → r1Random(-6, 6) → r2Random(-6, 6) → r3Text(("score=" * score)) → text1Textfield(f) → inputBox1Text(("Number of questions = " * problems)) → questionsText(("Accuracy = " * accu)) → accur
AI Drawing Prompt Reference
Create an interactive graph for practicing polynomial function writing. The graph shows a coordinate system with a randomly generated quadratic curve, whose coefficients are chosen from a fixed set, and three random translation parameters. A text input box is placed nearby for users to enter their guessed function expression. The display also includes current score, number of questions, and accuracy percentage. The curve should clearly show its intersections with the axes, and the interface updates the score based on how well the user's input matches the actual function. The layout is clean and suitable for educational use.
The prompt above was compiled from the original drawing commands and is for reference only.