
Writing Linear Equations from Their Graphs: Interactive Practice
Loading the math board and drawing, please wait…
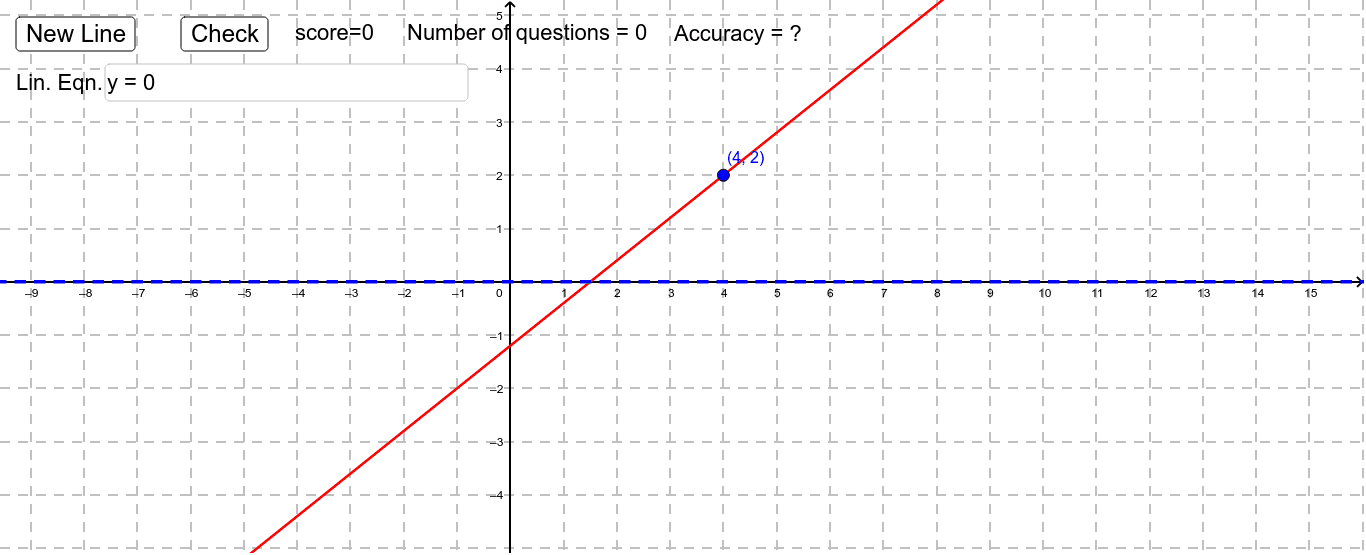
This GeoGebra example demonstrates how to derive a linear equation from a given straight-line graph, providing an interactive exercise for students to practice finding slope and intercept. The core mathematical concepts include the standard form y = mx + b, calculating slope (m) from two points, and identifying the y-intercept (b). Construction details: the Random and RandomElement commands generate random coordinates for problems, Text and Textfield objects display the question and provide an input box, button1 and button2 handle checking answers and advancing to the next question, while variables like score, accu, questions, and accur track performance. This resource is suitable for middle school to high school students learning about linear functions and equation-graph conversion, and can be used for classroom demonstrations or self-paced practice.
GeoGebra Commands & Parameters
Random(-5, 5) → x1Random(-5, 5) → y1RandomElement({-3, -2, -2.5, -1.5, -1, -0.8, -0.75, -0.6, -0.5, -0.4, -0.25, -0.2, 0.2, 0.25, 0.4, 0.5, 0.6, 0.75, 0.8, 1, 1.5, 2, 2.5, 3}) → mText(("score=" * score)) → text1Textfield(b) → inputBox1Text(("Number of questions = " * problems)) → questionsText(("Accuracy = " * accu)) → accur
AI Drawing Prompt Reference
Create an interactive exercise showing how to derive a linear equation from a straight-line graph. Randomly generate two points for the line, calculate the slope, and identify the y-intercept, displaying the equation y=mx+b. Include a text box for answers, buttons to check and proceed, and display score, question count, and accuracy.
The prompt above was compiled from the original drawing commands and is for reference only.