
World Series Winning Probability
Loading the math board and drawing, please wait…
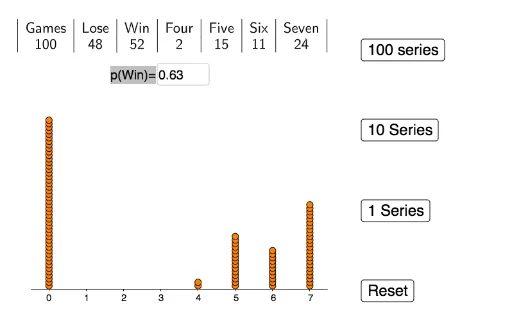
This example demonstrates how to calculate the probability of winning the World Series using mathematical models. Key math concepts include probability & statistics, matrix operations, conditional summation, and sequence generation. GeoGebra commands and objects used in construction are Sequence, Sum, IndexOf, If, CountIf, Length, TableText, DotPlot, and Textfield. Suitable for high school and above students to understand the application of probability theory in real-world sports events.
GeoGebra Commands & Parameters
Sequence(RandomBinomial[1, p], w, 1, 7) → GSum(G) → aSequence(Sum[Take[G, 1, w]], w, 1, 7) → WIndexOf(4, W) → bIf(Defined[b], b, 0) → cCountIf(x ≟ 0, data) → zeroCountIf(x ≟ 4, data) → fourCountIf(x ≟ 5, data) → fiveCountIf(x ≟ 6, data) → sixCountIf(x ≟ 7, data) → sevenLength(data) → dTableText({{"Games", "Lose", "Win", "Four", "Five", "Six", "Seven"}, {d, zero, d - zero, four, five, six, seven}}, "c|h") → text1DotPlot(data, false, 0.2) → L_1Textfield(p) → InputBox1