
What relationship is it?
Loading the math board and drawing, please wait…
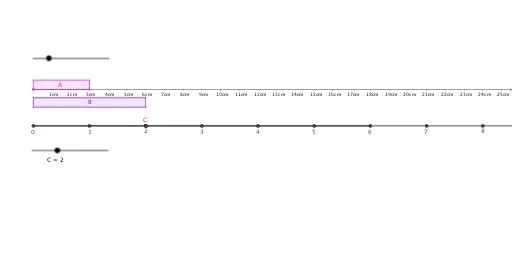
This example demonstrates mathematical relationships through geometric figures. It involves concepts such as multiplication, limits, Pythagoras' theorem, percentages, hyperbolas, and scatter plots. Using GeoGebra commands like Point, OrthogonalLine, Circle, Intersect, Polygon, Segment, and Ray, complex geometric figures can be constructed. Suitable for middle school mathematics education to help students understand various mathematical relationships.
GeoGebra Commands & Parameters
Point(yAxis) → AOrthogonalLine(A, yAxis) → fPoint(yAxis) → BOrthogonalLine(B, yAxis) → gCircle(A, 0.5) → cCircle(B, 0.5) → dIntersect(c, yAxis, 2) → CIntersect(d, yAxis, 1) → DOrthogonalLine(C, yAxis) → hOrthogonalLine(D, yAxis) → iCircle(D, 1) → eIntersect(e, yAxis, 1) → EOrthogonalLine(E, yAxis) → jCircle(E, N) → kIntersect(k, j, 1) → FCircle(F, N) → pIntersect(p, j, 1) → GCircle(G, N) → qIntersect(q, j, 1) → HCircle(H, N) → rIntersect(r, j, 1) → ICircle(I, N) → sIntersect(s, j, 1) → JCircle(J, N) → tIntersect(t, j, 1) → KOrthogonalLine(F, j) → lIntersect(h, l) → LIntersect(f, l) → OPolygon(C, A, O, L) → q1, c_1, a, o, l_1Circle(B, (M * N)) → d_1Intersect(d_1, g, 1) → POrthogonalLine(P, g) → mIntersect(i, m) → QPolygon(B, P, Q, D) → q2, b, p_1, q_1, d_2Segment(E, F) → nSegment(F, G) → f_1Segment(G, H) → g_1Segment(H, I) → h_1Segment(I, J) → i_1Segment(J, K) → j_1Intersect(j, m) → RIntersect(j, m) → SRay(E, F) → k_1Circle(K, N) → e_1Intersect(e_1, k_1, 2) → TCircle(T, N) → r_1Intersect(r_1, k_1, 2) → UCircle(U, N) → s_1Intersect(s_1, k_1, 2) → VCircle(V, N) → t_1Intersect(t_1, k_1, 2) → WCircle(W, N) → c_2Intersect(c_2, k_1, 2) → ZCircle(Z, N) → e_2Intersect(e_2, k_1, 2) → A_1Circle(A_1, N) → f_2Intersect(f_2, k_1, 2) → B_1Circle(B_1, N) → g_2Intersect(g_2, k_1, 2) → C_1Circle(C_1, N) → h_2Intersect(h_2, k_1, 2) → D_1