
Using Rectangular Coordinates to Construct Polygons and Sequences
Loading the math board and drawing, please wait…
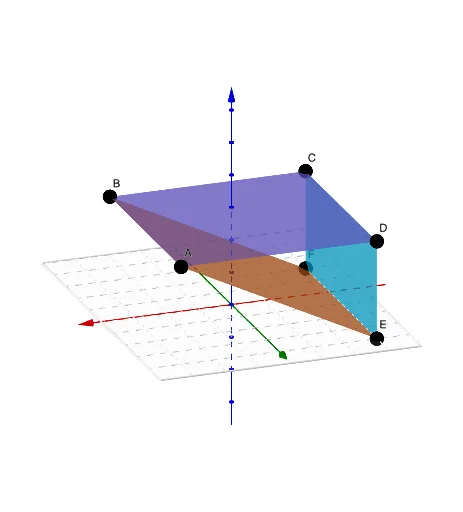
This example illustrates how to use rectangular coordinates to create polygons and sequence-based graphics, with interactive sliders for parameter control. It covers core concepts such as coordinate geometry, linear functions, sequence generation, and limits, helping learners explore the relationship between algebraic expressions and visual shapes. The construction leverages GeoGebra commands Polygon, Sequence, and Surface, along with objects like A1, B1, C1, D1, and sliders a, b, c, enabling dynamic manipulation of the figures. Designed for high school and early university mathematics courses, it also serves as a practical tool for mathematical modeling and programming education.
GeoGebra Commands & Parameters
Polygon(A1, D1, C1, B1) → q1, a, b, d, cSequence(Segment[(4, n), (-4, n)], n, -5, 5) → l1Sequence(Segment[(n, 5), (n, -5)], n, -4, 4) → l2Surface(-3, s, t, s, -2, 4, t, 0, 3) → eSurface(s, t, 3, s, -3, 3, t, -2, 4) → fSurface(s, t, 3 / 2 + s / 2, s, -3, 3, t, -2, 4) → g
AI Drawing Prompt Reference
In one coordinate system, first draw a quadrilateral polygon determined by a given set of corner points arranged in a specific order to form the polygon. Then add two families of parameterized line segments: one family has endpoints at x=4 and x=-4 while the y-coordinate follows a parameter n ranging from -5 to 5; the second family has endpoints at y=5 and y=-5 while the x-coordinate follows a parameter n ranging from -4 to 4. Finally, overlay three parameterized surfaces controlled by parameters s and t, each defined over the stated parameter ranges, with two of them using different parameterizations to produce related surface variants.
The prompt above was compiled from the original drawing commands and is for reference only.