
What is the graph of the complex equation
Loading the math board and drawing, please wait…
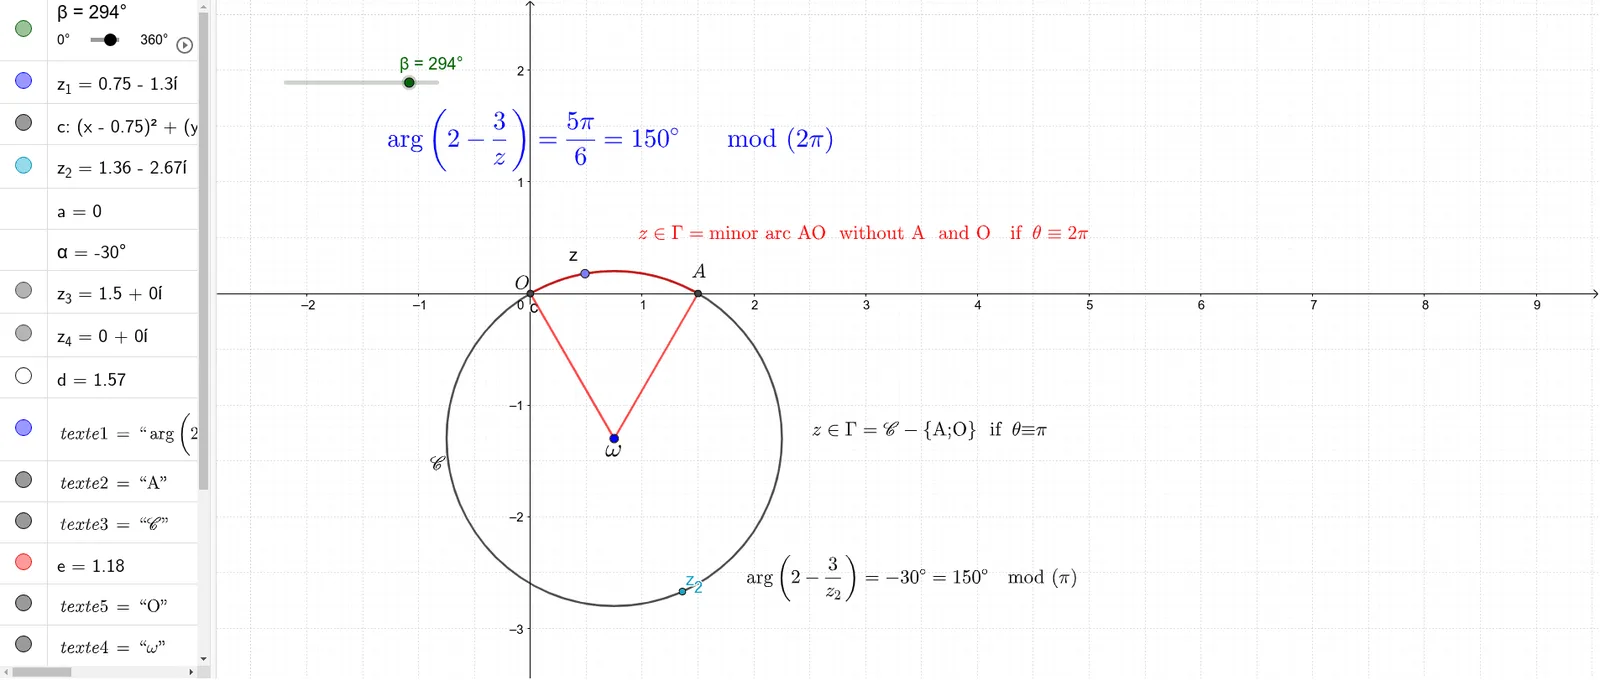
This example demonstrates the graph of a complex equation. The core mathematical concepts involved are complex numbers and trigonometric functions. Using GeoGebra commands such as Circle, CircleArc, CircleSector, and Point, the graph of the complex equation can be constructed. Suitable for high school mathematics education and learning.
GeoGebra Commands & Parameters
Circle(z_{1}, 3 / 2) → cCircleArc(z_{1}, z_3, z_4) → dCircleSector(z_{1}, z_3, z_4) → ePoint(e) → A
AI Drawing Prompt Reference
In the complex plane, start by choosing a point to act as the center. Draw a circle centered at this point with radius 3/2. Then select two points on the circle that determine the endpoints of an arc (the arc is defined using the center point together with two other complex-number points). Show the corresponding circular arc on the circle. Using the same center and the two arc endpoints, display the circular sector formed by the radius lines and the arc. Finally, mark a point associated with the sector to indicate the key constructed position.
The prompt above was compiled from the original drawing commands and is for reference only.