
What is the decimal? — Interactive Fraction-Decimal Conversion with Geometry
Loading the math board and drawing, please wait…
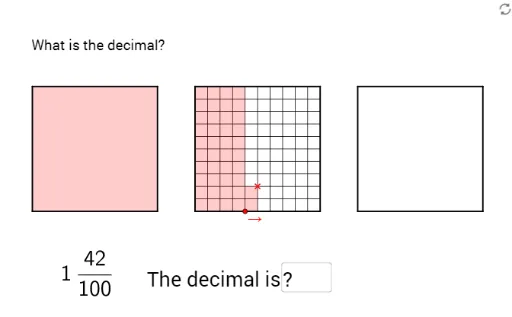
① This interactive GeoGebra example visually demonstrates the conversion between fractions and decimals, allowing users to input or adjust values and observe corresponding geometric representations and numerical changes. ② Core mathematical concepts include fractions, decimals, isosceles triangles, angles, cosine functions, and polygon areas, linking abstract numbers with visual shapes to clarify equivalence. ③ Construction highlights: using GeoGebra commands such as Corner, Point, Polygon, If, Sequence, and Textfield, with numerous objects (A_1, poly3, integer, text1, etc.) to build a dynamic, interactive model for fraction-decimal conversion. ④ Suitable for upper elementary to middle school students, ideal for classroom teaching of fraction-decimal relationships, and a useful reference for teachers creating interactive math materials.
GeoGebra Commands & Parameters
Corner(5) → A_1Point(Sequence[(k, 0), k, 0, 3.6, 0.1]) → APoint(Sequence[(x(A) + 0.1, j), j, 0, 1, 0.1]) → BPolygon((1.3, 0), (2.3, 0), (2.3, 1), (1.3, 1)) → poly3, i, j, k, lPolygon((2.6, 0), (3.6, 0), (3.6, 1), (2.6, 1)) → poly4, m, n, p, qIf(x(A) ≥ 1 ∧ x(A) < x(Vertex[poly3, 1]) ∨ x(A) ≥ x(Vertex[poly3, 2]) ∧ x(A) < x(Vertex[poly4, 1]) ∨ x(A) ≟ x(Vertex[poly4, 2]), true, false) → integerPolygon(A, A + (0.1, 0), A + (0.1, If[integer, 0, y(B)]), A + (0, If[integer, 0, y(B)])) → poly8, j_1, k_1, l_1, m_1Polygon((0, 0), (Min[x(A), 1], 0), (Min[x(A), 1], 1), (0, 1)) → poly5, r, s, t, a_1Polygon((x(Vertex[poly3, 1]), 0), (Max[Min[x(A), x(Vertex[poly3, 1]) + 1], x(Vertex[poly3, 1])], 0), (Max[Min[x(A), x(Vertex[poly3, 1]) + 1], x(Vertex[poly3, 1])], 1), (x(Vertex[poly3, 1]), 1)) → poly6, b_1, c_1, d_1, e_1Polygon((x(Vertex[poly4, 1]), 0), (Max[Min[x(A), x(Vertex[poly4, 1]) + 1], x(Vertex[poly4, 1])], 0), (Max[Min[x(A), x(Vertex[poly4, 1]) + 1], x(Vertex[poly4, 1])], 1), (x(Vertex[poly4, 1]), 1)) → poly7, f_1, g_1, h_1, i_1Polygon((0.8187524918794742, 1.1041021645196354), (1.818752491879475, 1.1041021645196354), (1.818752491879475, 2.1041021645196336), (0.8187524918794742, 2.1041021645196336)) → poly1, a, b, c, dPolygon((0, 0), (1, 0), (1, 1), (0, 1)) → poly2, e, f, g, hSequence(Segment[(0, j), (1, j)], j, 0, 1, 0.1) → list4Sequence(Segment[(x(Vertex[poly3, 1]), j), (x(Vertex[poly3, 1]) + 1, j)], j, 0, 1, 0.1) → list5Sequence(Segment[(x(Vertex[poly4, 1]), j), (x(Vertex[poly4, 1]) + 1, j)], j, 0, 1, 0.1) → list6Sequence(Segment[(i, 0), (i, 1)], i, 0, 1, 0.1) → list1Sequence(Segment[(x(Vertex[poly3, 1]) + i, 0), (x(Vertex[poly3, 1]) + i, 1)], i, 0, 1, 0.1) → list2Sequence(Segment[(x(Vertex[poly4, 1]) + i, 0), (x(Vertex[poly4, 1]) + i, 1)], i, 0, 1, 0.1) → list3If(y(B) < 1, (100 * poly8), 0) → hundredthdigitTextfield(Text1) → Eingabefeld2
AI Drawing Prompt Reference
Draw an interactive geometric model for fraction-decimal conversion. Place three 1x1 square grids side by side, each divided into 10 equal horizontal and vertical strips, forming small cells. The first grid is on the left, followed by the second and third grids to the right. Above the first grid, place a draggable point that controls a highlighted rectangle extending from the left edge of the grid to the point's horizontal position, with height varying based on the point's vertical position. In the second and third grids, fill corresponding small cell areas with different colors according to the point's position in the first grid, representing integer and decimal parts. Additionally, include a text field above the grids to display the current numeric value. The layout should be clear for observing the relationship between fractions and decimals.
The prompt above was compiled from the original drawing commands and is for reference only.