
Weather Temperature Linear Function Example
Loading the math board and drawing, please wait…
In collections
UCSS Secondary Math I Unit 4 Lesson 2
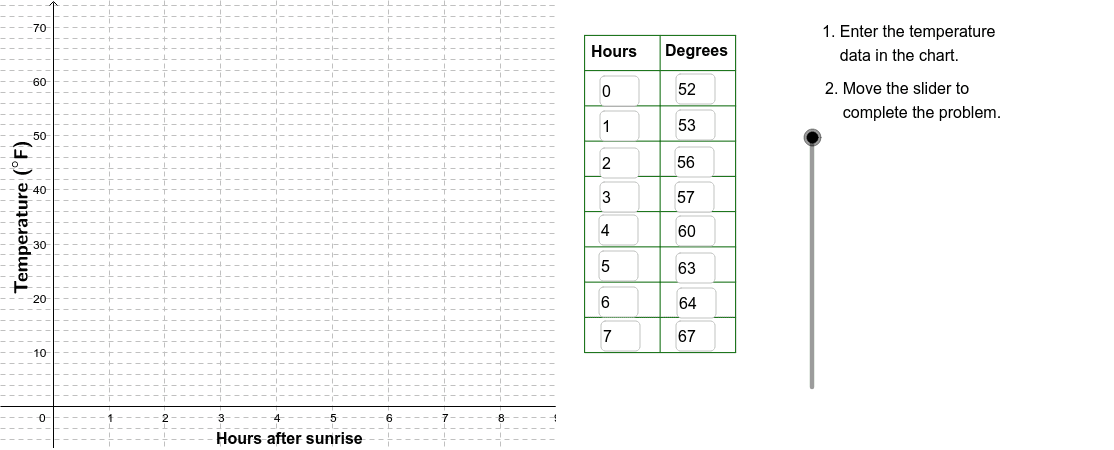
This example demonstrates how to plot a linear function based on hourly recorded temperature data. It involves core math concepts like linear equations, scatter plots, linear functions, and coordinate geometry. Construction highlights include using GeoGebra commands such as Corner, Polygon, Textfield, Sequence, Line, and VerticalText. Suitable for high school students learning function graphing and data analysis.
GeoGebra Commands & Parameters
Corner(2) → Corn2Corner(3) → Corn3Polygon(Corn1, Corn2, Corn3, Corn4) → poly1, corn1, corn2, corn3, corn4Textfield(A2) → InA2Textfield(A3) → InA3Textfield(A4) → InA4Textfield(A5) → InA5Textfield(A6) → InA6Textfield(A7) → InA7Textfield(A8) → InA8Textfield(A9) → InA9Textfield(B9) → InB9Textfield(B8) → InB8Textfield(B7) → InB7Textfield(B6) → InB6Textfield(B5) → InB5Textfield(B4) → InB4Textfield(B3) → InB3Textfield(B2) → InB2Sequence(Segment[(9.5, 10 + (6.5 * j)), (12.2, 10 + (6.5 * j))], j, 0, 9) → LnListSequence(Segment[(9.5 + (1.35 * j), 10), (9.5 + (1.35 * j), 68.5)], j, 0, 2) → LnList2Line(I, J) → FitLineVerticalText("\text{Temperature (}°\text{F)}") → DownLegend
AI Drawing Prompt Reference
Plot a linear function based on hourly recorded temperature data. First, draw a quadrilateral, then add text input boxes at specific positions to input temperature and time data. Next, draw a series of vertical and horizontal lines to form a grid background. Finally, fit a line through the given data points and add a vertical label 'Temperature (°F)' below.
The prompt above was compiled from the original drawing commands and is for reference only.