
Weather Prediction Simulation
Loading the math board and drawing, please wait…
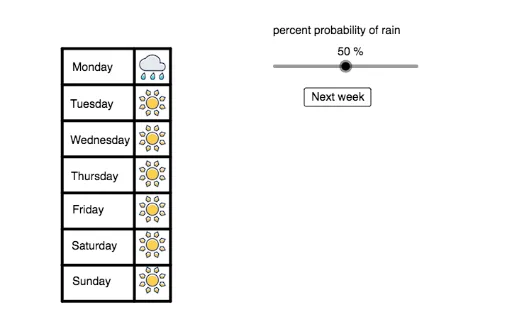
This example demonstrates how to simulate the relationship between weather predictions and actual outcomes. It involves core math concepts like Probability & Statistics, Linear Programming/Optimization, Line Segment, Prism, and Sphere. Construction highlights include using Segment and Text commands with objects like probability, button1, totalrain, totaldays, and multiple text elements. Suitable for high school students learning probability statistics and geometric constructions to understand predictive models.
GeoGebra Commands & Parameters
Segment(U, W) → iSegment(R, T) → jSegment(O, Q) → kSegment(L, N) → lSegment(I, K) → mSegment(G, H) → nSegment(C, E) → pSegment(U, C) → qSegment(V, D) → rSegment(W, E) → sSegment(C, A) → fSegment(E, Z) → hSegment(D, B) → gSegment(A, Z) → tText("Cumulative ratio of rainy days to total days: 0.4") → ratio
AI Drawing Prompt Reference
Create a weather prediction simulation diagram, including line segments representing probability relationships, such as line segment UW for a probability of 0.4, line segment VW for actual rainy days, and line segment AE for total days. Add text to display the cumulative ratio of rainy days to total days as 0.4. Start by drawing line segment UW, then draw line segments VW and AE, and finally add the text.
The prompt above was compiled from the original drawing commands and is for reference only.