
Volumes of Solids of Revolution
Loading the math board and drawing, please wait…
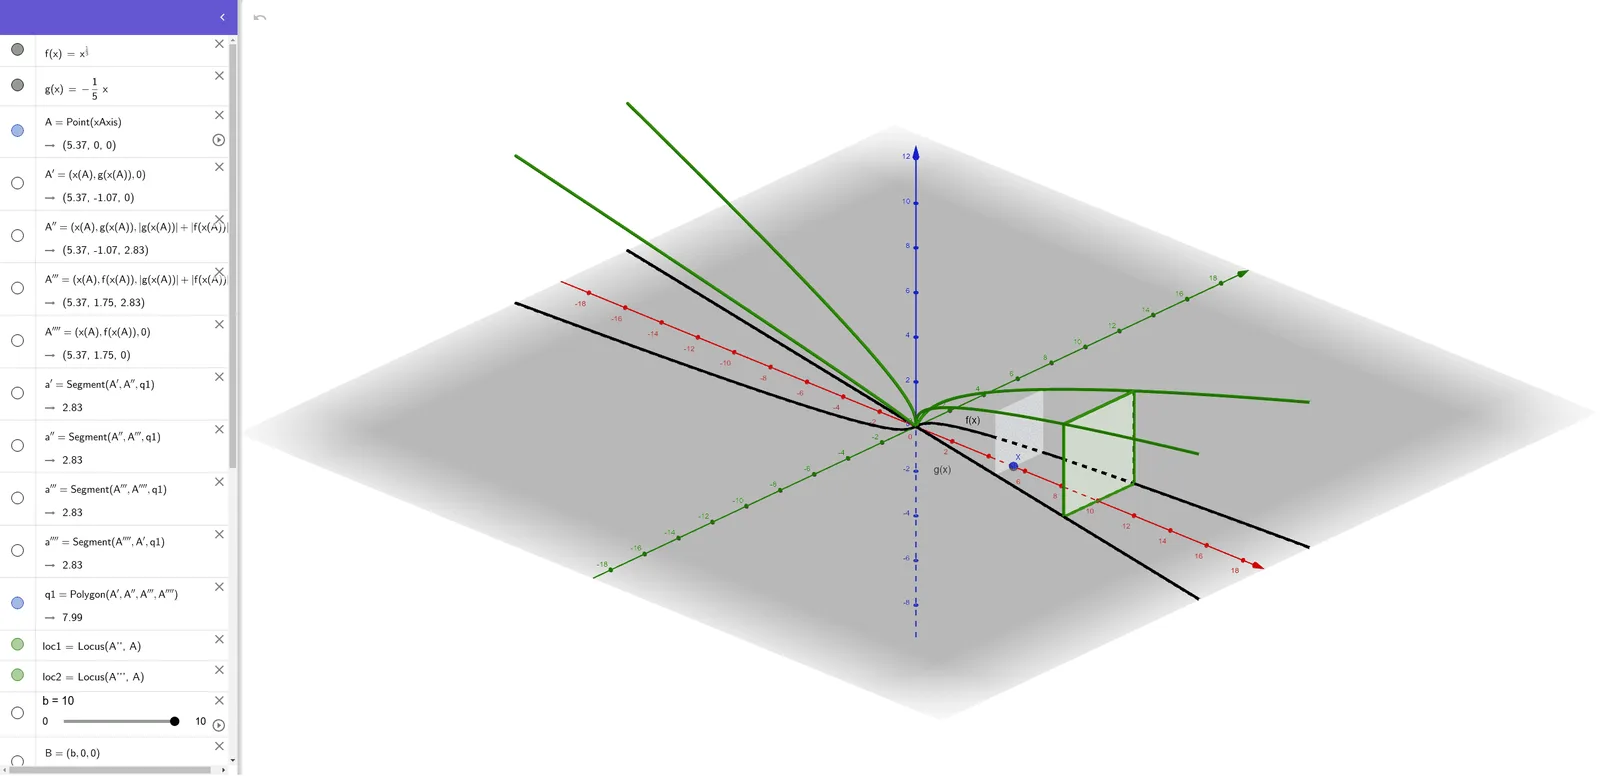
This example demonstrates how to generate solids of revolution by rotating a function graph and calculating their volumes. Key mathematical concepts include functions, integration, and solid geometry. Using GeoGebra commands such as Point, Polygon, and Locus, the trajectory of the solid of revolution is constructed. Suitable for high school mathematics education and learning.
GeoGebra Commands & Parameters
Point(xAxis) → APolygon(A', A'', A''', A'''') → q1, a', a'', a''', a''''Locus(A'', A) → loc1Locus(A''', A) → loc2Polygon(B', B'', B''', B'''') → q2, b', b'', b''', b''''
AI Drawing Prompt Reference
Draw a demonstration of the volume of solids of revolution, showing the trajectory formed by rotating a function graph and calculating the volume. Start by drawing a line segment along the x-axis, then construct multiple polygons based on this segment to form the cross-sections of the solid. Use two locus commands to draw the side trajectories of the solid of revolution, and finally complete the solid with polygon commands, illustrating the relationship between functions, integration, and solid geometry.
The prompt above was compiled from the original drawing commands and is for reference only.