
Volumes of Revolution by Gail Neal
Loading the math board and drawing, please wait…
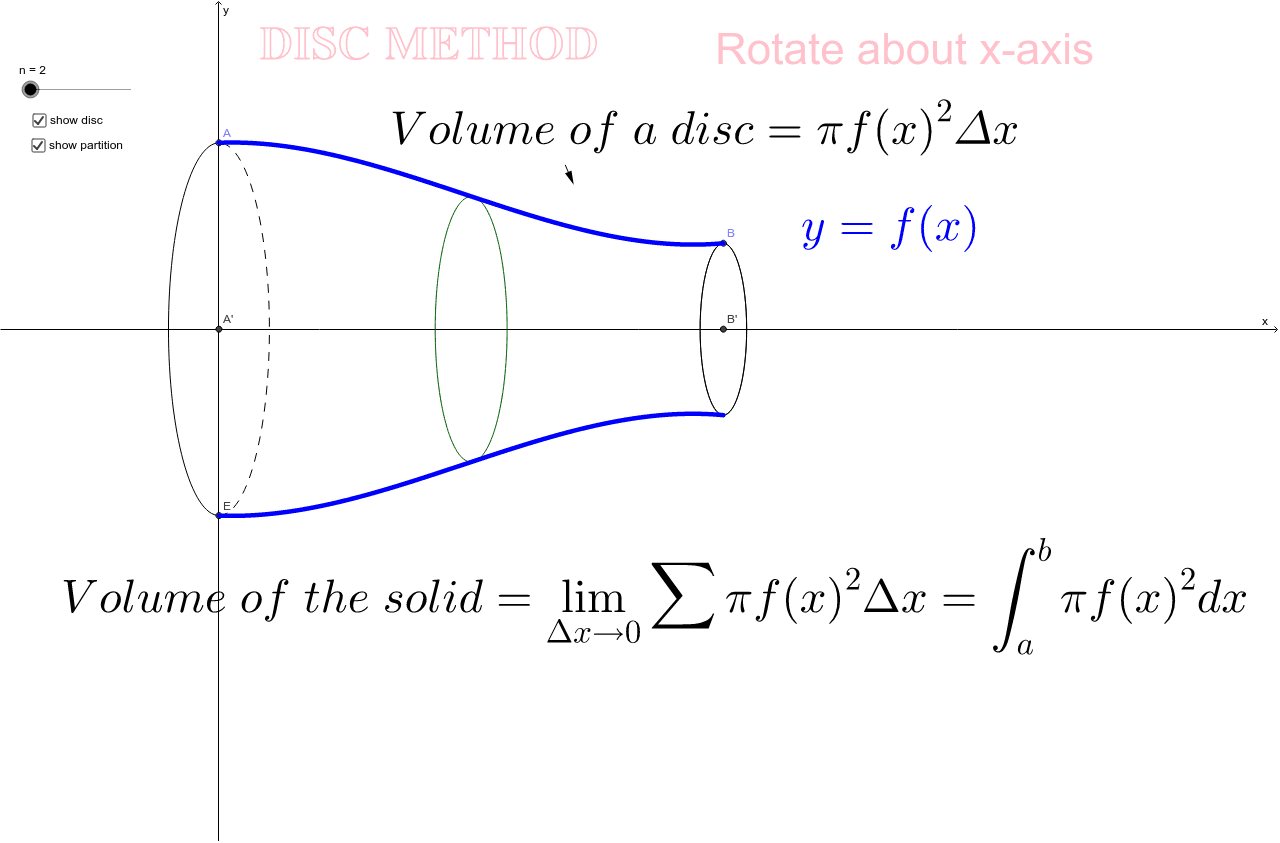
This example demonstrates how to generate and calculate the volume of a solid of revolution by rotating a 2D shape. Key math concepts include integration, derivatives, function graphing, and linear programming. It uses GeoGebra commands like Point, OrthogonalLine, Intersect, Arc, Segment, Sequence, and Vector to construct the shape, compute cross-sectional areas, and create the 3D surface. Suitable for high school and above students learning calculus, solid geometry, and optimization problems.
GeoGebra Commands & Parameters
Point(f) → AOrthogonalLine(A, xAxis) → aPoint(f) → BOrthogonalLine(B, xAxis) → cIntersect(c, xAxis) → B'Intersect(f', a, 1) → EArc(e, A, E) → hArc(e, E, A) → kIntersect(f', c, 1) → FArc(d, B, F) → pArc(d, F, B) → qPoint(f) → COrthogonalLine(C, xAxis) → iIntersect(f', i, 1) → HIntersect(i, xAxis) → ISegment(C, J) → height_1Segment(K, H) → height_2Arc(E_1, C, H) → Arc_{1a}Arc(E_1, H, C) → Arc_{1b}Arc(E_2, J, K) → Arc_{2a}Arc(E_2, K, J) → Arc_{2b}Intersect(a, xAxis) → A'Sequence((x - x(A) - (k * a_1))^(2) / b^(2) + y^(2) = f(x(A) + (k * a_1))^(2), k, 1, n) → partitionPoint(height_1) → MVector(L, M) → uPoint(xAxis) → D
AI Drawing Prompt Reference
Draw a 2D shape that, when rotated, forms a solid of revolution, illustrating the use of integration and calculus. Start by plotting a function curve, then take two points on it, draw perpendicular lines to the x-axis, and connect their intersections. Next, draw arcs centered at these points, and another pair of arcs centered at the intersections of the perpendiculars with the function. Arrange these cross-sections along the x-axis to form the 3D shape, highlighting key points and segments to clearly show the volume calculation process.
The prompt above was compiled from the original drawing commands and is for reference only.