
Volume via Rectangular Cross Sections Visualization
Loading the math board and drawing, please wait…
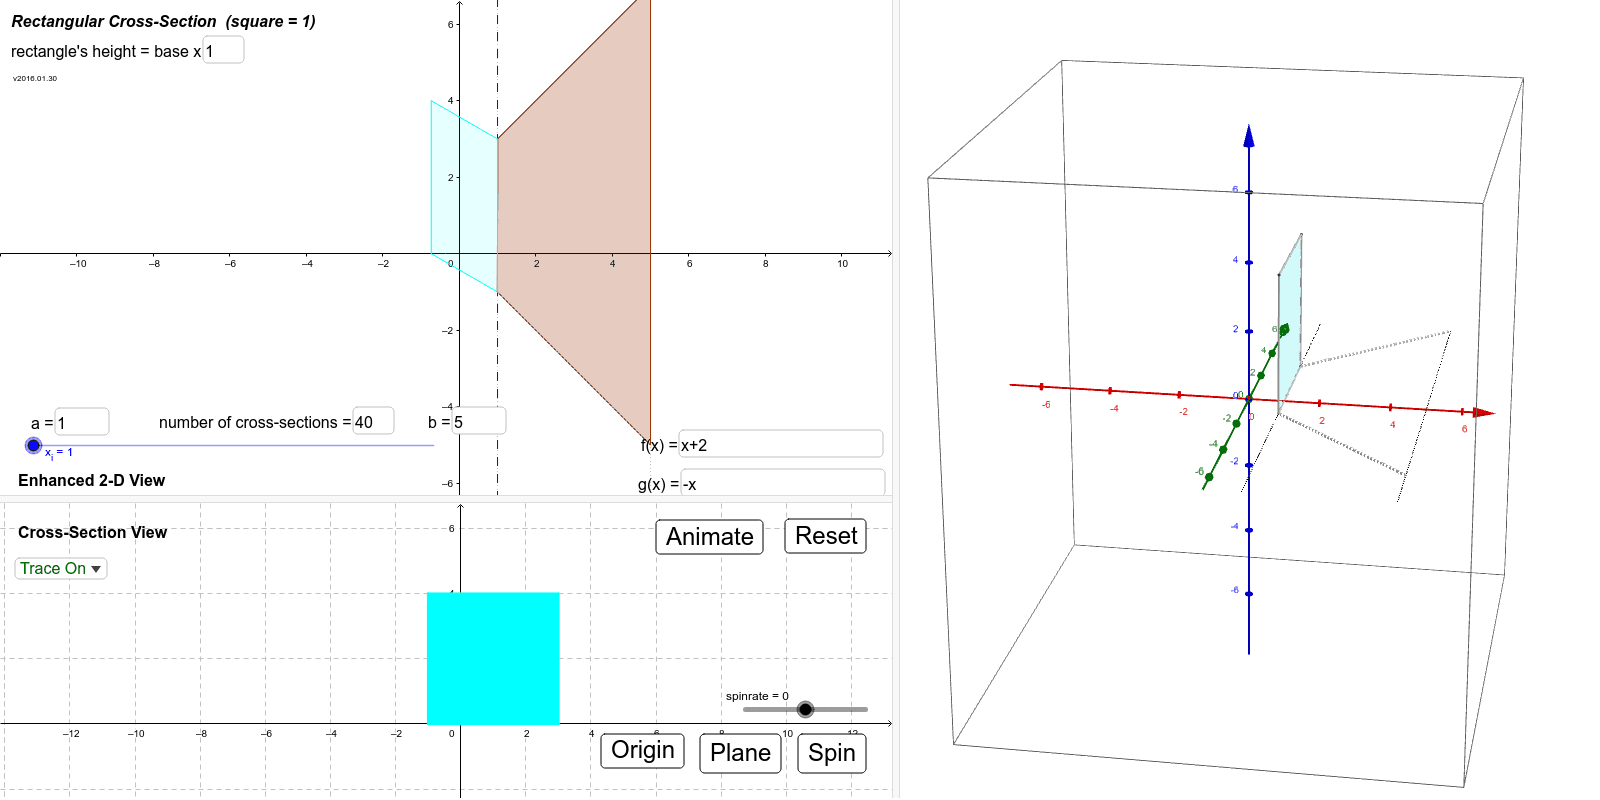
This example is designed to help visualize objects constructed from rectangular cross sections. By setting parameters such as the rectangle's height, two functions, limits, axis of rotation, and more, users can intuitively observe the formation of the volume of a rotated solid. Key mathematical concepts include integral calculation, function graph rotation, and solid geometry. The construction utilizes GeoGebra commands and objects like Intersect, Textfield, Min, Max, IntegralBetween, Segment, Plane, Polygon, and SelectedIndex. This example is suitable for high school and above students to understand the calculation method of rotational solid volume and the geometric transformation of function graphs.
GeoGebra Commands & Parameters
Intersect(f, l_c, (1, 3)) → P_{fc1}Intersect(g, l_c, (1, -1)) → P_{gc}Textfield(a) → inputBox_aTextfield(b) → inputBox_bMin(abs(rad_f), abs(rad_g)) → rad_iMax(abs(rad_f), abs(rad_g)) → rad_oIntersect(f, l_b, (5, 7)) → P_{fb}Intersect(g, l_b, (5, -5)) → P_{gb}Intersect(f, l_a, (1, 3)) → P_{fa}Intersect(g, l_a, (1, -1)) → P_{ga}IntegralBetween(f, g, Min[x(P_{fa}), x(P_{ga})], Max[x(P_{fb}), x(P_{gb})]) → RSegment((0, y_{rotation}), (0, If[abs(rad_f) ≥ abs(rad_g), y(P_{fc1}), y(P_{gc})])) → r_oSegment((0, y_{rotation}), (0, If[abs(rad_f) < abs(rad_g), y(P_{fc1}), y(P_{gc})])) → r_iPlane((x_i, y_{rotation}, rad_o), x = x_i) → pln3dTextfield(n) → InputBox1Polygon(P_{fc1}, P_{fcr}, P_{gc1}, P_{gc}) → rec_1, seg_{12}, seg_{13}, seg_{14}, seg_{11}Polygon(P_{fc2}, P_{fcr2}, P_{gcr2}, P_{gc2}) → rec_2, seg_{21}, seg_{22}, seg_{23}, seg_{24}Polygon(P_{fc1}, P_{fcr3}, P_{gcr3}, P_{gc}) → rec_3, seg_{31}, seg_{32}, seg_{33}, seg_{34}Textfield(rec_{height}) → InputBox2SelectedIndex(lstTraceOpt) → lstTOIndexTextfield(tf) → InputBox_fTextfield(tg) → InputBox_g
AI Drawing Prompt Reference
Draw the graphs of two functions f(x) and g(x) and shade the region between them from x=a to x=b. Show rectangular cross‑sections perpendicular to the x‑axis, each with a height set by a parameter, and indicate the axis of rotation y=y0 and a vertical slicing plane at x=x_i. Include text fields for entering a, b, the functions, and the cross‑section height.
The prompt above was compiled from the original drawing commands and is for reference only.