
Volume Between Two Curves
Loading the math board and drawing, please wait…
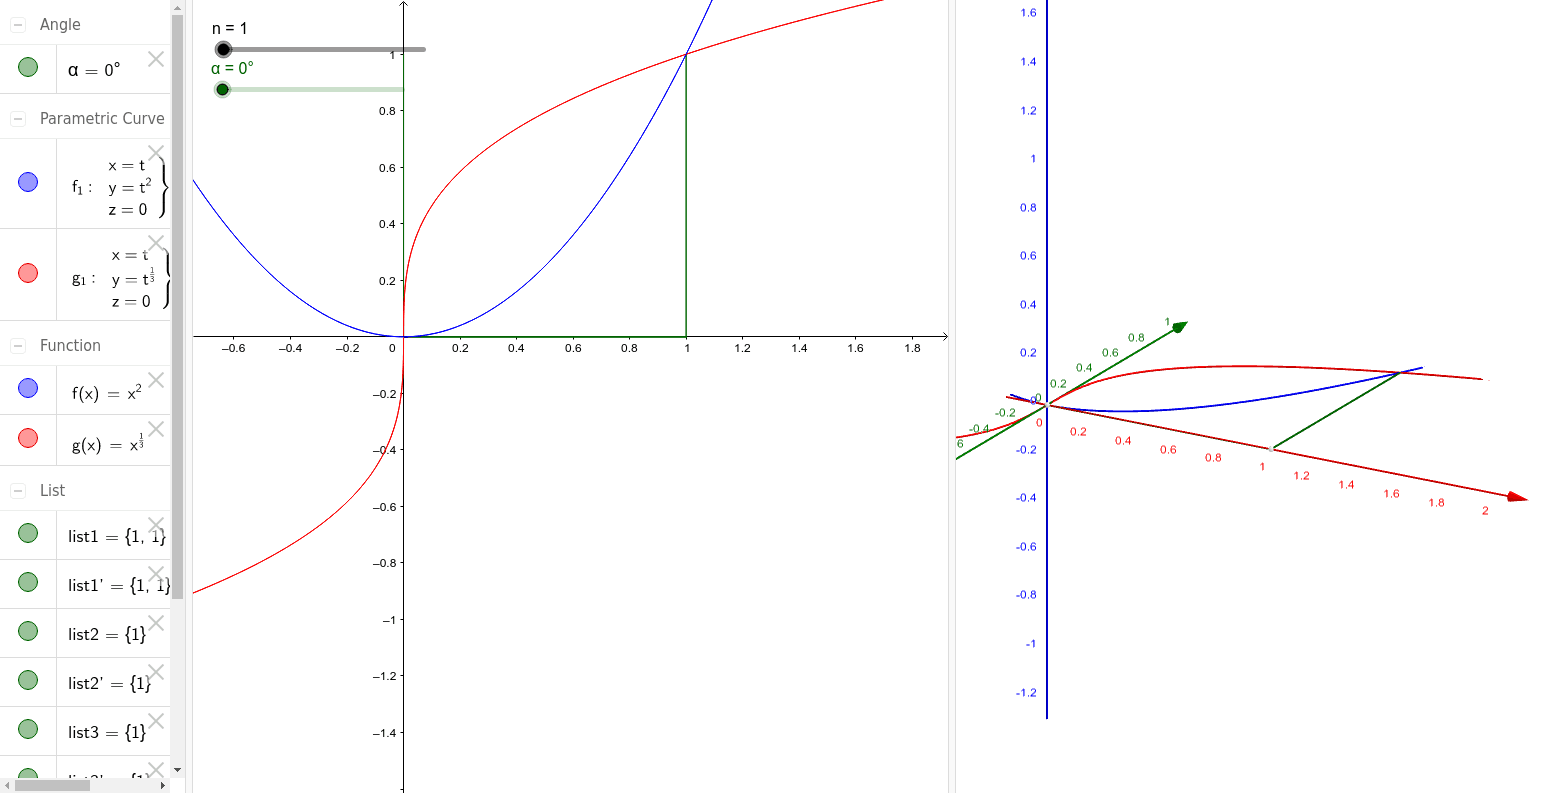
This example demonstrates how to calculate the volume between two curves by rotating the region between their graphs. Key mathematical concepts include functions, integration, and solid geometry. It utilizes commands like Sequence and Rotate in GeoGebra. Suitable for high school and above students learning calculus and solid geometry.
GeoGebra Commands & Parameters
Sequence(Segment[(i / n, f(i / n)), ((i + 1) / n, f(i / n))], i, 0, n - 1, 1) → list2Sequence(Segment[(i / n, g(i / n)), ((i + 1) / n, g(i / n))], i, 0, n - 1, 1) → list3Sequence(Segment[(i / n, f((i - 1) / n)), (i / n, g(i / n))], i, 0, n, 1) → list1Rotate(g, α, xAxis) → g_1Rotate(f, α, xAxis) → f_1Rotate(list1, α, xAxis) → list1'Rotate(list2, α, xAxis) → list2'Rotate(list3, α, xAxis) → list3'Sequence(Cylinder[(i / n, 0), ((i + 1) / n, 0), g(i / n)], i, 0, n - 1, 1) → list4Sequence(Cylinder[(i / n, 0), ((i + 1) / n, 0), f(i / n)], i, 0, n - 1, 1) → list5
AI Drawing Prompt Reference
Draw the volume between the regions of two functions f(x) and g(x) rotated around the x-axis. First, plot the graphs of f(x) and g(x), then create a series of vertical line segments, rotate these segments around the x-axis to form cylinders, and finally calculate the volume difference between the two solids.
The prompt above was compiled from the original drawing commands and is for reference only.