
Visualizing Volume of Solids of Revolution about x-axis
Loading the math board and drawing, please wait…
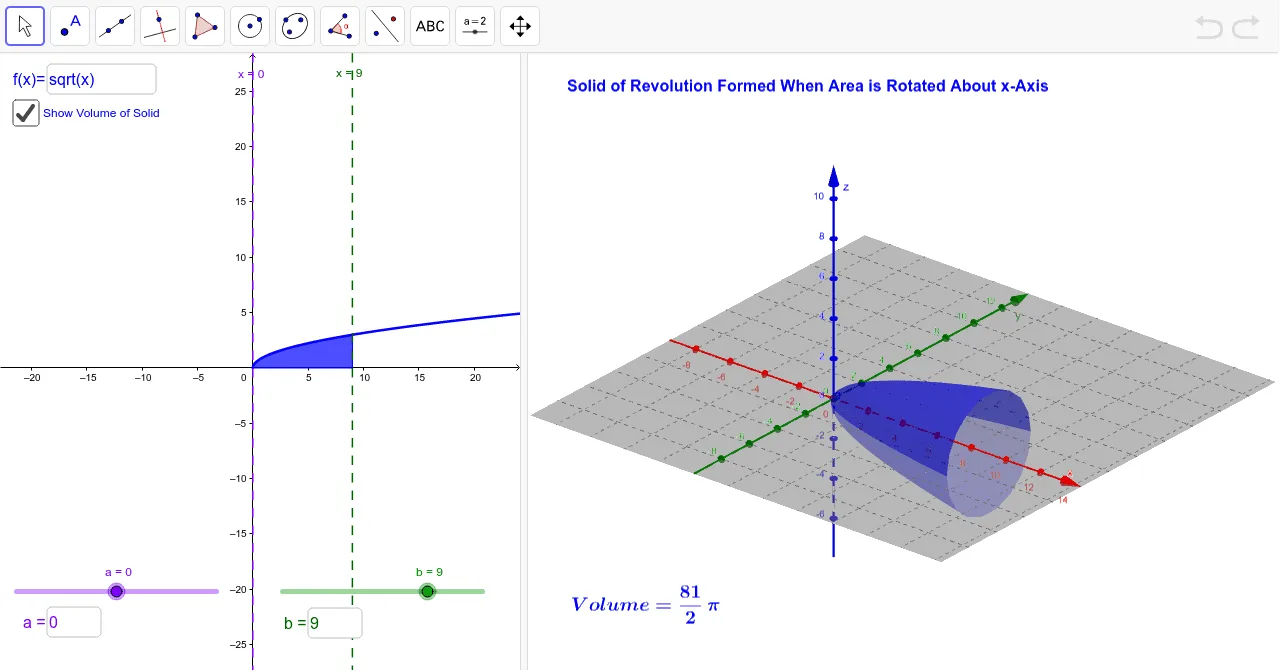
① This interactive applet allows students to enter a function and integration limits, then dynamically visualizes the solid formed by revolving the region around the x-axis, with a 3D illustration and computed volume. ② Core math concepts include definite integrals, the disk method for volumes of revolution, and the connection between function graphs and solid geometry. ③ Construction highlights: uses GeoGebra commands such as Textfield, InputBox for user input, Integral for definite integration, Surface to generate the revolution surface, and FractionText to display exact volume fractions; key objects include f, d, e, a, b, c, g, h, vol, voldpi, and text elements, all updating in real time. ④ Suitable for high school seniors or introductory college calculus students to grasp the geometric meaning of volume integrals, and for teachers as a classroom demonstration tool.
GeoGebra Commands & Parameters
Textfield(f) → InputBox1Integral(f, a, b) → cSurface(t, (f(t) * cos(u)), (f(t) * sin(u)), t, a, b, u, 0, 6.28319) → gTextfield(a) → InputBox2Textfield(b) → InputBox3Integral(h, a, b) → volFractionText(voldpi) → text2