
Volume of a Solid of Revolution Around the x-Axis
Loading the math board and drawing, please wait…
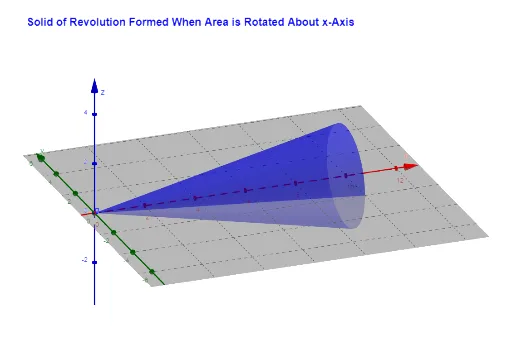
This example visualizes the volume of a solid formed by rotating a function curve around the x-axis, linking the 3D geometry with the computed integral value. It highlights core ideas of the solid-of-revolution method (disk/washers/infinitesimal “slices”), the use of definite/indefinite integrals, and typical function relationships that may involve trigonometric expressions, similarity-style transformations, and arithmetic-mean logic when defining bounds or combining parts. Construction is done in GeoGebra by using Textfield to set and display parameters and labels, Integral to compute the volume, and Surface to generate the rotated 3D solid. FractionText is used to show key fractional expressions and results clearly. The build uses objects such as f, d, e, multiple InputBox controls (InputBox1/2/3), parameters like a, b, a_1, b_1, c, g, h, i, and outputs/annotations like vol, voldpi, and text1–text3. Suitable for high school–early college calculus, teaching integral applications and 3D geometric visualization.
GeoGebra Commands & Parameters
Textfield(f) → InputBox1Integral(f, a, b) → cSurface(t, (f(t) * cos(u)), (f(t) * sin(u)), t, a, b, u, 0, 6.28319) → gTextfield(a) → InputBox2Textfield(b) → InputBox3Integral(h, a, b) → volFractionText(voldpi) → text2
AI Drawing Prompt Reference
Draw a solid of revolution formed by rotating a function curve around the x-axis. The function is defined over the interval [a, b], and the volume is calculated using integration. The 3D shape of the solid should be displayed, along with key parameters like a, b, and the volume value. Use text boxes to show parameters and results, ensuring the graphic is clear and understandable.
The prompt above was compiled from the original drawing commands and is for reference only.