
Visualizing Unit p-Norm Spheres in 2D
Loading the math board and drawing, please wait…
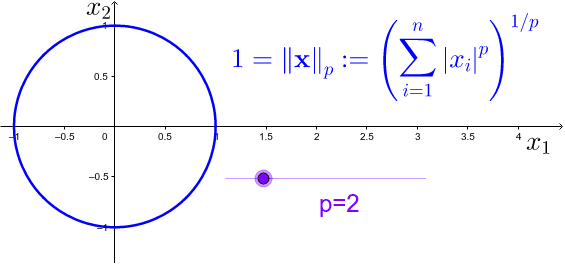
This example demonstrates the family of unit p‑norm spheres (the curves |x|^p+|y|^p=1) in the plane as the parameter p varies. It covers the mathematical concepts of p‑norms, unit balls, convexity, and the use of parametric/inequality descriptions for geometric shapes. Construction uses a slider for p, conditional logic (If), polygon drawing (Polygon), and mirror symmetry (Mirror) together with objects J, p, A, B, C, D, F, poly1, b, f, d, c, G, I, text1‑3, E, H, K, L, M to create a dynamic illustration. Suitable for high‑school advanced mathematics, undergraduate linear algebra or analytic geometry courses, and as a teaching resource for dynamic geometry and graphing.
GeoGebra Commands & Parameters
If(p ≤ J, p, Infinity) → APolygon(B, F, D, C) → poly1, b, f, d, cIf(p > J, poly1) → GIf(p ≤ J, If[2^(-1 / A) ≤ x ≤ 1, (1 - x^(A))^(1 / A), If[-1 ≤ x ≤ (-2^(-1 / A)), (1 - ((-x))^(A))^(1 / A)]]) → EIf(p ≤ J, If[2^(-1 / A) ≤ x ≤ 1, (-(1 - x^(p))^(1 / p)), If[-1 ≤ x ≤ (-2^(-1 / A)), (-(1 - ((-x))^(p))^(1 / p))]]) → HMirror(E, y = x) → KMirror(H, y = x) → LIf(p ≥ 1, 255, 0) → M
AI Drawing Prompt Reference
Create a dynamic 2D plot showing the family of unit p-norm curves defined by |x|^p + |y|^p = 1. Use a slider to vary the parameter p. When p is less than or equal to a threshold, display four symmetric curve segments in the four quadrants, each defined piecewise with positive and negative roots over specific x-intervals. When p exceeds the threshold, show a polygon with four vertices approximating the unit ball. The curves are symmetric about the line y = x. Change the curve color based on whether p is at least 1 (e.g., red for p≥1, blue otherwise). Include text labels showing the current p value.
The prompt above was compiled from the original drawing commands and is for reference only.