
Visualizing the Taylor Series Approximation of e^x
Loading the math board and drawing, please wait…
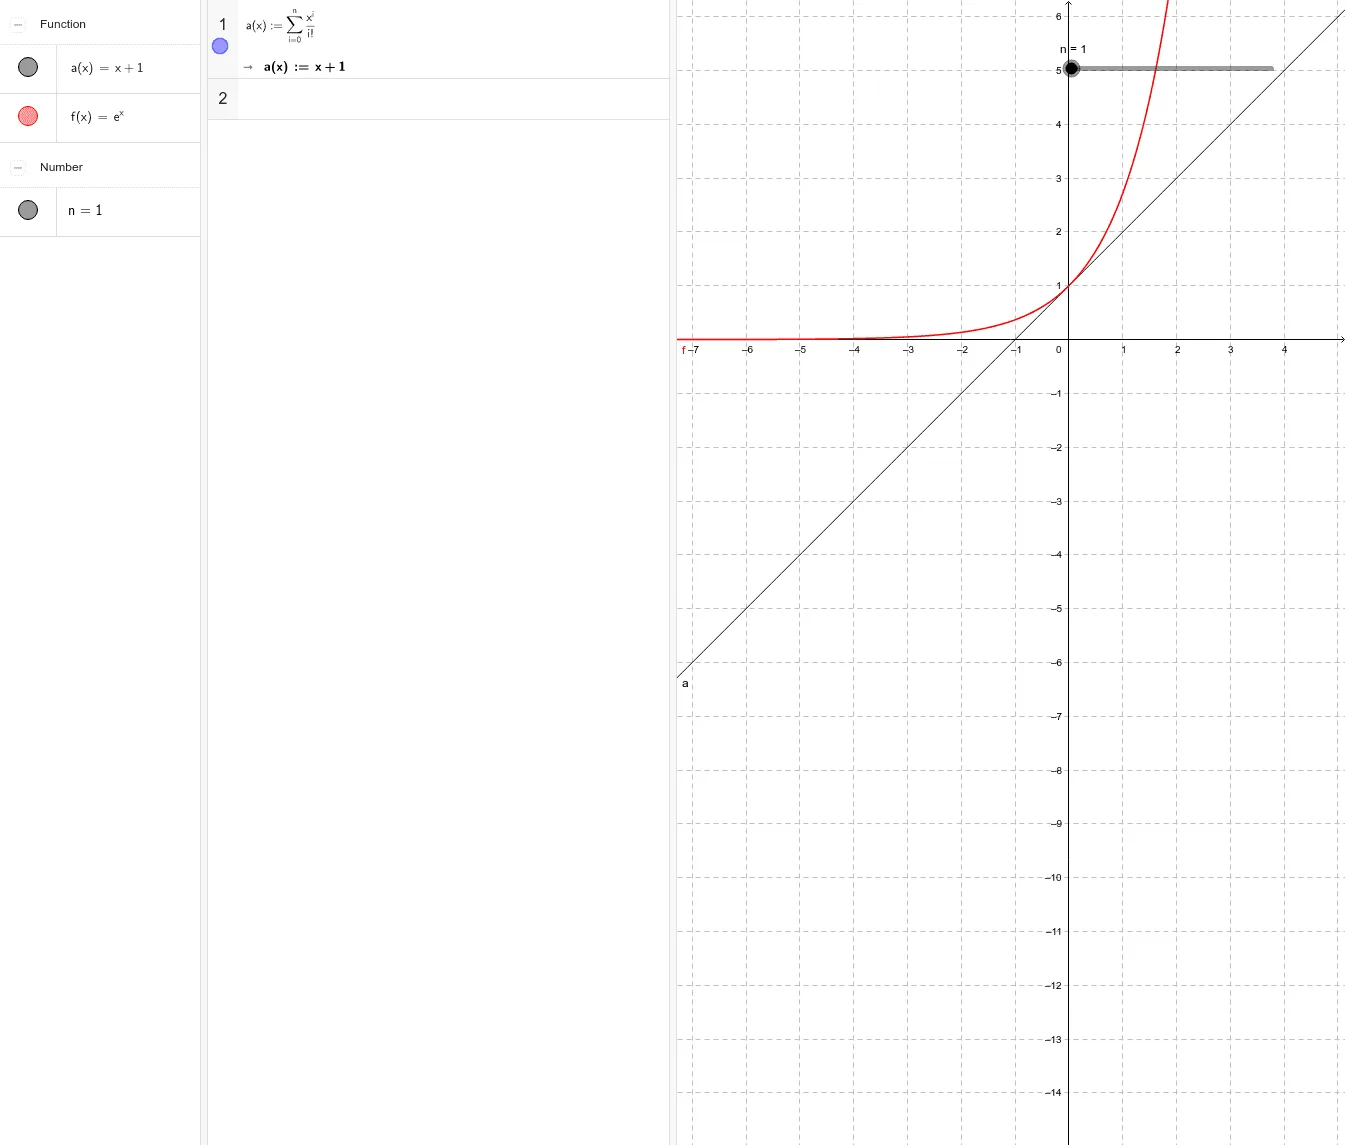
This example demonstrates how the Taylor series gradually approximates the function e^x. By changing the series order n, learners can visually observe how the truncated Taylor polynomial converges toward the true exponential curve over a chosen interval, highlighting the approximation/error behavior as n increases. The key mathematical ideas include Taylor expansion, power series (as an infinite series representation), and the use of finite sums to build practical function approximations. Construction is driven by the GeoGebra objects from the provided construct summary: defining the parameter n and coefficient a, and using function f to represent either e^x or its Taylor-series-based approximation, then plotting the resulting approximating expressions as n varies for direct comparison. Suitable for high school advanced study and undergraduate calculus/math analysis contexts, especially for teaching polynomial approximation and providing an intuitive understanding of series convergence.
GeoGebra Commands & Parameters
Numeric n(1.0)Function af(x) = ℯ^(x)
AI Drawing Prompt Reference
In one coordinate plane, set a numerical parameter n to represent the Taylor series order. Define the target function f(x)=e^x as the reference curve. Then build a truncated Taylor polynomial approximation of e^x using the same order n (a finite sum from the power-series expansion) and plot this approximating function over a chosen interval together with the original e^x curve, so the visual behavior of the approximation as n changes is clear.
The prompt above was compiled from the original drawing commands and is for reference only.