
Visualizing the Natural Logarithm as a Limit of Radical Functions
Loading the math board and drawing, please wait…
In collections
Exponents and Logarithms
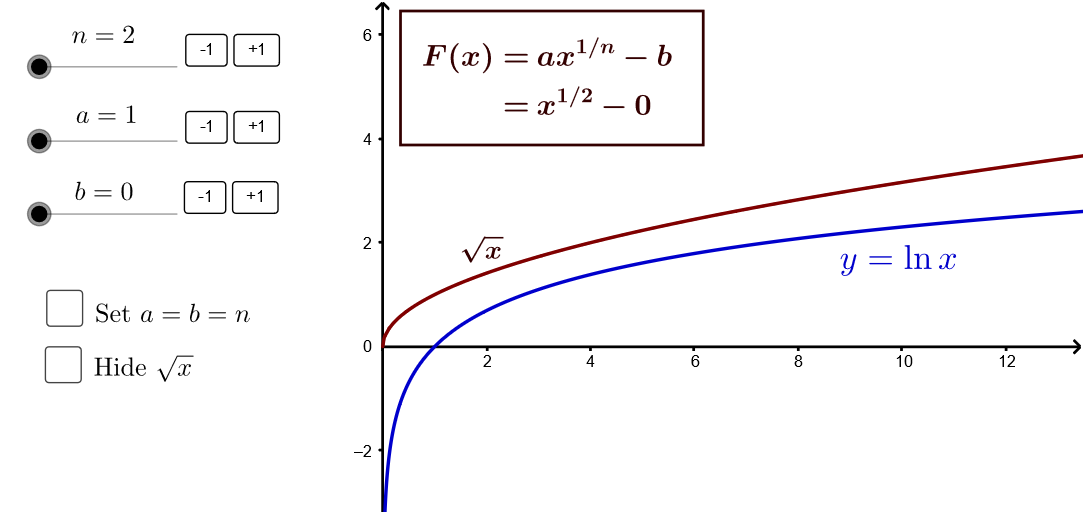
This GeoGebra example provides a visual, step-by-step tutorial demonstrating how the natural logarithm function can be represented as a limit of radical functions, specifically by slowly transforming the function sqrt(x). The core mathematical concepts covered include limits, natural logarithms, radical functions, function transformations, and the geometric interpretation of slopes and differences. To construct this interactive visualization, the applet employs GeoGebra commands such as If, along with various objects including sliders, interactive buttons, dynamic text labels, and custom function graphs. These elements work together to smoothly animate the transition of the curve and display the convergence behavior. This resource is highly suitable for calculus and pre-calculus courses in high school or introductory university mathematics, helping students intuitively grasp the limit definition of the natural log function.
GeoGebra Commands & Parameters
If(a ≟ 1, "", "" + a) → textaIf(b ≟ 0, "", "-" + b) → textbIf(alln ≟ false, "b", "n") → textbornIf(alln ≟ false, "a", "n") → textaorn
AI Drawing Prompt Reference
Create an interactive visualization that shows the natural logarithm emerging as the limit of a family of radical functions: start with the square‑root curve, use a slider to vary a parameter that gradually transforms the graph, add a button to animate the transition, display dynamic labels for the current parameter values, and watch the curve smoothly converge to the graph of ln(x), illustrating limits, function transformations, and the geometric interpretation of slopes.
The prompt above was compiled from the original drawing commands and is for reference only.