
Graphing Functions of Complex Variables
Loading the math board and drawing, please wait…
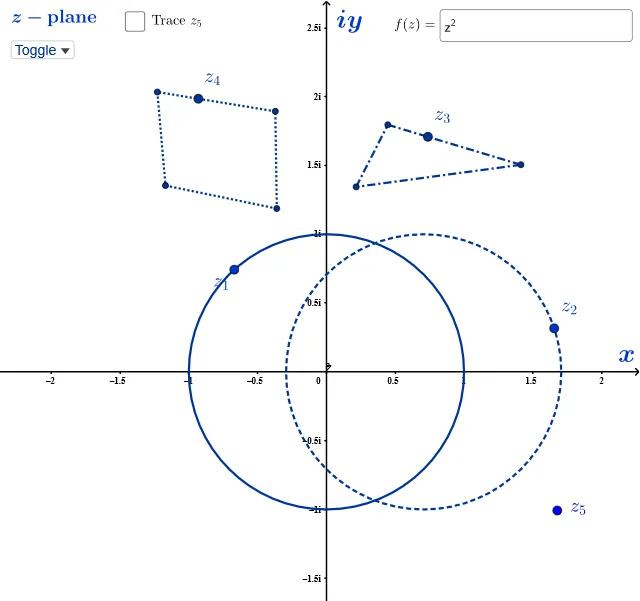
This example demonstrates the graphing of complex functions. Key mathematical concepts include complex numbers, functions, and their graphs. Using GeoGebra commands such as Circle, Locus, and Polygon, dynamic displays of complex function properties are shown. Suitable for high school and above mathematics education and learning.
GeoGebra Commands & Parameters
LaTeX(ff) → textfCircle(C2C, 1) → c2Point(c1) → z1Point(c2) → z2Locus(w1, z1) → w1LocusLocus(w2, z2) → w2LocusPolygon(A, B, C) → z3triangle, c_1, a_1, b_1Point(z3triangle) → z3Locus(w3, z3) → w3LocusPolygon(D, E, F, G) → poly1, d_1, ef, f_1, gPoint(poly1) → z4Locus(w4, z4) → w4LocusTextfield(ff) → inputfAppend("Toggle", {g1, g2, g3, g4, g5}) → graphsSequence(Take[Text[inputf], k, k], k, 1, Length[Text[inputf]]) → take1Sequence(Take[Text[inputf], k, k + 2], k, 1, Length[Text[inputf]] - 2) → take3
AI Drawing Prompt Reference
Create a visual demonstration of complex function graphing. Start with two unit circles, one for input and one for output. Place a moving point on the input circle, map it through a complex function to a point on the output circle, and trace the path of the mapped point. Then draw a triangle, pick a point inside it, map it similarly, and trace its locus. Next, draw a quadrilateral, select an interior point, map it, and trace the resulting curve. Finally, include an editable text field for the function expression, with the traced graphs updating dynamically.
The prompt above was compiled from the original drawing commands and is for reference only.