
Visualizing the Derivative of the Inverse
Loading the math board and drawing, please wait…
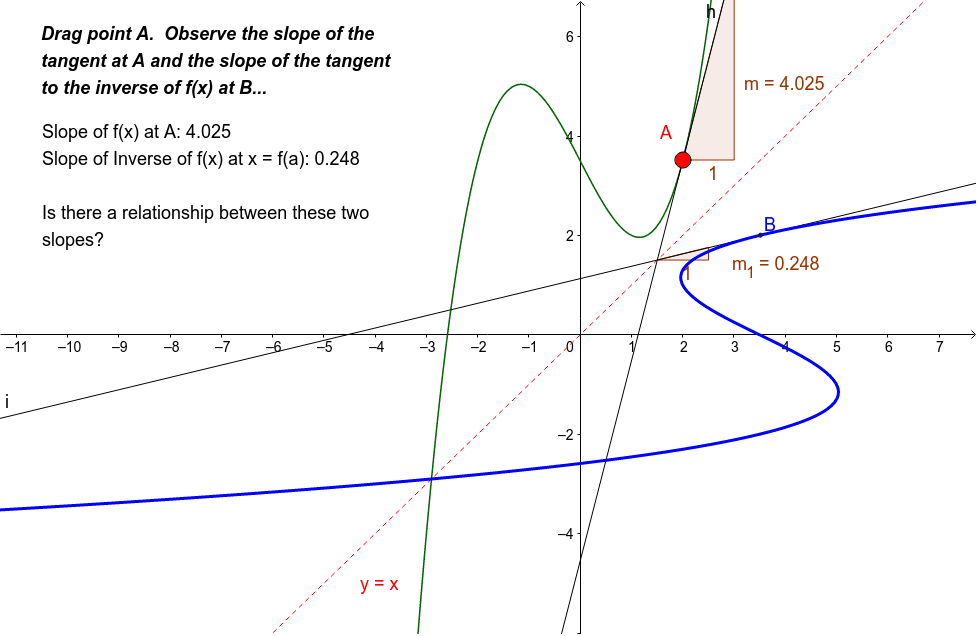
① This interactive GeoGebra example visualizes the geometric relationship between a function and its inverse, demonstrating that the derivative of the inverse at a point equals the reciprocal of the derivative of the original function at the corresponding point. ② Core mathematical concepts include inverse functions, derivatives, tangent line slopes, symmetry about the line y=x, and the trigonometric connection between slope and angle. ③ Construction details: Based on the summary, the construction uses GeoGebra commands such as Point, Locus, Tangent, Slope, Intersect, and Line, creating functions f and g (mutually inverse), points A and B, a locus loc1, tangent lines h and i, slope objects m and m_1, and multiple text labels (text1, text2, text3) to display numerical relationships. ④ Suitable for advanced high school or introductory college calculus students, this example helps learners grasp the geometric meaning of the inverse function derivative formula, and serves as an effective classroom demonstration or self-guided exploration tool.
GeoGebra Commands & Parameters
Point(g) → ALocus(B, A) → loc1Tangent(A, g) → hSlope(h) → mIntersect(f, h) → CLine(C, B) → iSlope(i) → m_1
AI Drawing Prompt Reference
Draw the graphs of a function and its inverse, symmetric about the line y=x. Place a point on the inverse curve, and draw the tangent line to the inverse at that point, showing its slope. Then find the intersection of this tangent with the original function's graph, and connect this intersection to the point on the inverse curve with a line segment, displaying its slope. Include both curves, the symmetry line, the tangent point, the intersection, the two slope labels, and text annotations explaining that the two slopes are reciprocals.
The prompt above was compiled from the original drawing commands and is for reference only.