
Instantaneous Rate of Change Exploration
Loading the math board and drawing, please wait…
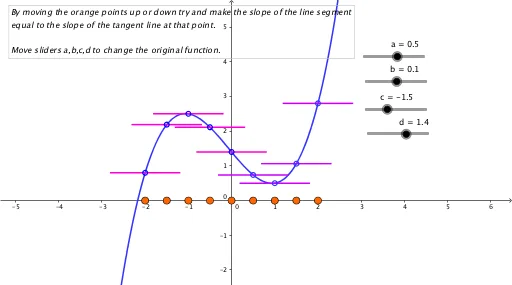
This example demonstrates exploring the instantaneous rate of change using GeoGebra. Key mathematical concepts include derivatives and functions. By using commands such as Point, Circle, Intersect, Segment, and Derivative, users can dynamically observe changes in function graphs. Suitable for high school mathematics education and learning.
GeoGebra Commands & Parameters
Point(e) → ACircle(B, 0.8) → kIntersect(j, k, 1) → CIntersect(j, k, 2) → DSegment(C, D) → lDerivative(f) → f'Point(h) → ECircle(F, 0.8) → qIntersect(p, q, 1) → GIntersect(p, q, 2) → HSegment(G, H) → nPoint(g) → ICircle(J, 0.8) → sIntersect(r, s, 1) → MIntersect(r, s, 2) → NSegment(M, N) → tPoint(i) → KCircle(L, 0.8) → c_1Intersect(f_1, c_1, 1) → OIntersect(f_1, c_1, 2) → PSegment(O, P) → a_1Point(b_1) → QCircle(R, 0.8) → k_1Intersect(p_1, k_1, 1) → SIntersect(p_1, k_1, 2) → TSegment(S, T) → i_1Point(d_1) → UCircle(V, 0.8) → r_1Intersect(q_1, r_1, 2) → WIntersect(q_1, r_1, 1) → ZSegment(Z, W) → j_1Point(e_1) → A_1Circle(B_1, 0.8) → t_1Intersect(s_1, t_1, 2) → C_1Intersect(s_1, t_1, 1) → D_1Segment(D_1, C_1) → l_1Point(g_1) → E_1Circle(F_1, 0.8) → c_2Intersect(f_2, c_2, 1) → G_1Intersect(f_2, c_2, 2) → H_1Segment(G_1, H_1) → m_1Point(h_1) → I_1Circle(J_1, 0.8) → d_2Intersect(g_2, d_2, 1) → K_1Intersect(g_2, d_2, 2) → L_1Segment(K_1, L_1) → n_1
AI Drawing Prompt Reference
Draw a function graph and dynamically observe the instantaneous rate of change. First, draw a function f, then select a point A on the function and draw a circle k centered at A. Using the intersection points C and D of circle k and function f, draw line segment l. Next, calculate the derivative f' of function f, and select a point E on f'. Draw a circle q centered at E. Using the intersection points G and H of circle q and f', draw line segment n. Repeat the above steps to add more circles and line segments as specified.
The prompt above was compiled from the original drawing commands and is for reference only.