
Visualizing the Derivative of Cosine
Loading the math board and drawing, please wait…
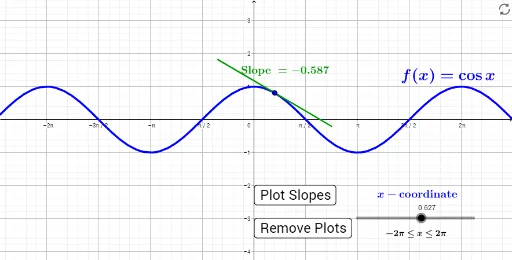
This GeoGebra example dynamically illustrates the geometric meaning of the derivative of the cosine function y = cos(x), showing how the slope of the tangent line at any point on the curve changes. The core mathematical concepts involve the definition of the derivative, the relationship between tangent slope and instantaneous rate of change, and the fundamental result that the derivative of cosine is negative sine. Construction highlights: using the Tangent command to draw the tangent line at a moving point A on the cosine curve, and the Segment command to create a visible tangent segment; sliders or buttons (button1, button2) control the point's position, while text objects (text1, text3, text4) display the current slope value; additional function objects (i, j) plot the derivative curve for comparison. This example is suitable for high school or introductory college calculus students, helping them intuitively grasp the geometric interpretation of the derivative as the slope of the tangent, and verify the derivative formula for cosine. By interacting with the controls, learners can observe the tangent line rotating as the point moves, with slope values ranging from 0 to ±1, reinforcing the connection between the sign of the derivative and the function's increasing or decreasing behavior.
GeoGebra Commands & Parameters
Tangent(A, f) → iSegment(A_1, A_2) → j
AI Drawing Prompt Reference
Draw the graph of the cosine function and plot a tangent line at any point on the curve to show how the slope changes. Also, plot the sine function to represent the derivative of cosine for comparison. Use a slider to control the position of the point on the curve and label the slope of the tangent line.
The prompt above was compiled from the original drawing commands and is for reference only.