
Normal Distribution Quiz
Loading the math board and drawing, please wait…
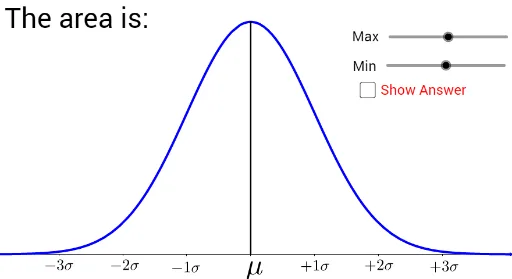
This example demonstrates the calculation of areas under the normal distribution curve and segmentations; involves core math concepts like normal distribution, integral, linear equations, quadratic functions, fractions, and cuboids; constructed using GeoGebra commands Integral and Segment with objects a, b, g, c, d, text series, and e; suitable for high school and above learners to understand normal distribution calculations and geometric representations in probability & statistics.
GeoGebra Commands & Parameters
Integral(g, a, b) → cSegment((0, 0), (0, g(0))) → d
AI Drawing Prompt Reference
Draw a normal distribution curve and indicate the area under the curve within the interval [a, b], represent this area geometrically, and include a line segment from the origin to the point on the curve at x=0, demonstrating core math concepts like normal distribution, integral, linear equations, quadratic functions, fractions, and geometric solids, suitable for high school and above learners to understand normal distribution calculations and geometric representations in probability & statistics.
The prompt above was compiled from the original drawing commands and is for reference only.