
COVID-19 Data Fitting and Geometric Analysis
Loading the math board and drawing, please wait…
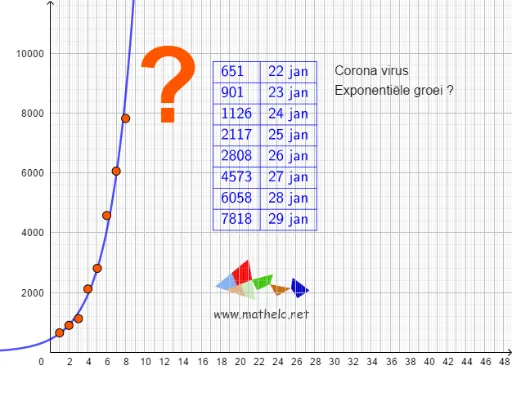
This example demonstrates exponential function fitting and linear regression analysis of COVID-19 data using GeoGebra, exploring correlations with geometric figures like circles and triangles. Core math concepts include exponential functions, linear regression, circle equations, limits, centroid calculation, and right triangle properties. The construction leverages commands like FitExp for exponential fitting and TableText for data display, utilizing objects A2-A29 and B2-B9. Suitable for high school and above, illustrating the integration of data visualization, function fitting, and geometric constructions.
GeoGebra Commands & Parameters
FitExp(data) → fTableText({{B2, C2}, {B3, C3}, {B4, C4}, {B5, C5}, {B6, C6}, {B7, C7}, {B8, C8}, {B9, C9}}, "|_ll") → tekst1
AI Drawing Prompt Reference
Create a graph showing COVID-19 data with an exponential fit curve and linear regression line, including a text box displaying the data points, and incorporate geometric shapes like circles and triangles to visualize correlations and mathematical concepts.
The prompt above was compiled from the original drawing commands and is for reference only.