
Visualizing the Chain Rule
Loading the math board and drawing, please wait…
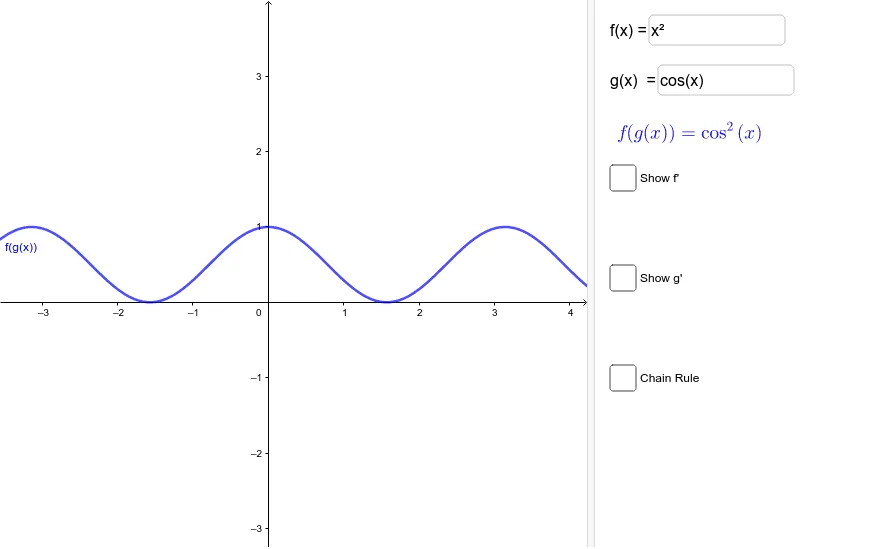
① This GeoGebra example interactively demonstrates the chain rule for differentiating composite functions. Users can input arbitrary functions f and g, and observe how the composite function h = f∘g and its derivative h' change in real time. ② The core mathematical concept is the chain rule from calculus: h'(x) = f'(g(x))·g'(x), involving composite functions, derivatives, function graphs, and similarity transformations. ③ Construction highlights: The applet uses text fields (Textfield, InputBox1, InputBox2) for user-defined f and g, defines the composite h, intermediate variable p, and derivatives f', g', h' via commands, and displays symbolic expressions using text objects (text1–text4). The graphs are plotted dynamically, linking inputs to outputs. ④ Suitable for advanced high school or introductory college calculus students to grasp the geometric and algebraic meaning of the chain rule, and useful for classroom demonstrations.
GeoGebra Commands & Parameters
Textfield(f) → InputBox1Textfield(g) → InputBox2
AI Drawing Prompt Reference
Create an interactive visualization demonstrating the chain rule, allowing users to input arbitrary functions f and g to observe the real-time changes in the composite function h = f∘g and its derivative h'. Use input fields for f and g, define h and an intermediate variable p, calculate derivatives f', g', h', display symbolic expressions, and dynamically plot graphs to illustrate the chain rule h'(x) = f'(g(x))·g'(x).
The prompt above was compiled from the original drawing commands and is for reference only.