
Visualizing Quadratic Functions ax²+bx+c=0
Loading the math board and drawing, please wait…
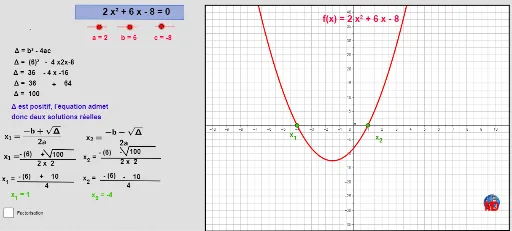
This example visually demonstrates the graph and properties of quadratic functions ax²+bx+c=0. It covers core math concepts like parabola, function graph, vertex, axis of symmetry, and intersection points. Key GeoGebra commands used include Intersect, Extremum, Function, Segment, Point, Polygon, and If. Suitable for high school students learning quadratic function graphs, properties, and geometric transformations.
GeoGebra Commands & Parameters
Intersect(f, xAxis) → A, BExtremum(f) → SFunction(f, -8, 8) → hSegment(J, K) → eSegment(L, M) → gSegment(N, O) → iSegment(O, P) → jSegment(P, Q) → kSegment(R, S_1) → lSegment(S_1, T) → mSegment(T, U) → nSegment(V, W) → pSegment(Z, A1) → qPoint(xAxis) → CPoint(xAxis) → B1Point(xAxis) → C1Point(xAxis) → D1Point(xAxis) → E1Point(xAxis) → F1Point(xAxis) → G1Point(xAxis) → H1Intersect(xAxis, yAxis) → I1Point(xAxis) → J1Point(xAxis) → K1Point(xAxis) → L1Point(xAxis) → M1Point(xAxis) → N1Point(yAxis) → P1Point(yAxis) → Q1Point(yAxis) → R1Point(yAxis) → S1Point(yAxis) → T1Point(yAxis) → U1Point(yAxis) → V1Point(yAxis) → W1Point(yAxis) → Z1Point(yAxis) → A2Point(yAxis) → C2Point(yAxis) → D2Point(yAxis) → E2Point(yAxis) → G2Point(yAxis) → H2Point(yAxis) → I2Point(yAxis) → J2Point(yAxis) → K2Point(yAxis) → L2Point(yAxis) → M2Point(yAxis) → N2Point(yAxis) → O2Point(yAxis) → F2Point(yAxis) → B2Point(yAxis) → P2Point(yAxis) → Q2Point(yAxis) → R2Point(yAxis) → S2Point(yAxis) → U2Point(yAxis) → V2Point(yAxis) → W2Point(yAxis) → Z2Point(xAxis) → A3Point(xAxis) → B3Point(xAxis) → C3Point(xAxis) → D3Point(xAxis) → E3Point(xAxis) → F3Point(xAxis) → G3Point(xAxis) → H3Point(xAxis) → I3Point(xAxis) → J3Point(xAxis) → K3Point(xAxis) → L3Point(xAxis) → M3Point(xAxis) → O1Point(xAxis) → N3Point(xAxis) → O3Point(xAxis) → P3Point(yAxis) → Q3Point(xAxis) → R3Point(yAxis) → S3Segment(H5, I5) → dPolygon(J5, K5, L5, M5) → poly1, j5_1, k5_1, l5_1, m5_1Polygon(A_1, B_1, C_1, D_1) → poly2, a_1, b_1, c_1, d_1Polygon(A_1, D_1, C_1, B_1) → poly3, a_2, d_2, c_2, b_2If(X1 > 0, "", "+") → plus1If(X2 > 0, "", "+") → plus2If(seul < 0, "+", "") → plus3
AI Drawing Prompt Reference
Draw a quadratic function parabola in standard form. First plot the curve itself, then mark its two intersection points with the x-axis and its vertex (extremum). Place multiple points along the x-axis and y-axis to serve as grid references. From these axis points, draw several vertical and horizontal segments to form an auxiliary grid or framework around the parabola. Also mark the origin where the axes intersect. The overall image shows a parabola with grid lines, highlighting its shape, axis of symmetry, and key intersection points.
The prompt above was compiled from the original drawing commands and is for reference only.