
Visualizing Percentages by Shar Gayangos
Loading the math board and drawing, please wait…
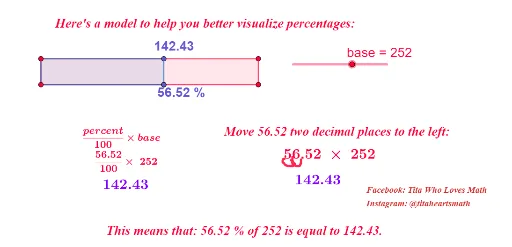
This example demonstrates the geometric representation and understanding of percentages through dynamic visuals. It involves core concepts like percentages, area, geometric transformations, and conditional probability. Construction highlights the use of commands such as Point, Intersect, Polygon, OrthogonalLine, and PolyLine. Suitable for middle school students and math enthusiasts to explore the visual aspect of percentages and their applications.
GeoGebra Commands & Parameters
Point(yAxis) → AIntersect(xAxis, yAxis) → BPoint(xAxis) → CPolygon(A, B, C, D) → q1, a, b, c, dIntersect(b, d) → FIntersect(b, xAxis) → GIntersect(d, b) → HIntersect(d, b) → EPoint(b) → IOrthogonalLine(I, d) → fIntersect(f, b) → JIntersect(f, g) → KPolygon(A, B, I, K) → q2, a_1, b_1, i, kPolyLine((119.62389287202397, -0.005776767302525365), (NaN, NaN), (116.13067532268998, -0.0060176626157397335), (115.92519193743503, -0.00591442176721929), (115.51422516692516, -0.005811180918698847), (115.7197085521801, -0.005707940070178404), (115.7197085521801, -0.005570285605484479), (NaN, NaN), (115.10325839641527, -0.005811180918698847), (NaN, NaN), (115.10325839641527, -0.005811180918698847), (115.51422516692516, -0.00591442176721929), (119.62389287202397, -0.005776767302525365), (115.7197085521801, -0.006086489848086696), (116.13067532268998, -0.006258557928954102), (114.89777501116033, -0.006258557928954102), (113.45939131437575, -0.006258557928954102), (112.84294115861093, -0.006224144312780621), (112.2264910028461, -0.006155317080433658), (111.81552423233622, -0.006052076231913215), (111.19907407657139, -0.005983248999566253), (111.19907407657139, -0.005845594534872328), (111.40455746182634, -0.005742353686351885), (119.62389287202397, -0.005983248999566253), (112.02100761759115, -0.005707940070178404), true, (119.41840948676902, -0.006120903464260177), (119.00744271625915, -0.006258557928954102), (118.18550917523939, -0.006258557928954102), (117.36357563421961, -0.006258557928954102), (116.7471254784548, -0.006224144312780621), (116.7471254784548, -0.006086489848086696)) → stroke1
AI Drawing Prompt Reference
Draw a quadrilateral with four points A, B, C, and D, where A is on the y-axis, B is the intersection of the x-axis and y-axis, C is on the x-axis, and D is the intersection of lines b and d. Then, form a new quadrilateral using B, D, the intersection of b and x-axis G, and the intersection of b and y-axis. Next, draw a line perpendicular to D, intersecting b and g at points J and K, forming another quadrilateral. Finally, use a series of coordinate points to draw a curve, simulating the change in percentages.
The prompt above was compiled from the original drawing commands and is for reference only.