
Visualizing Multiplication Between 3D and 2D Numbers
Loading the math board and drawing, please wait…
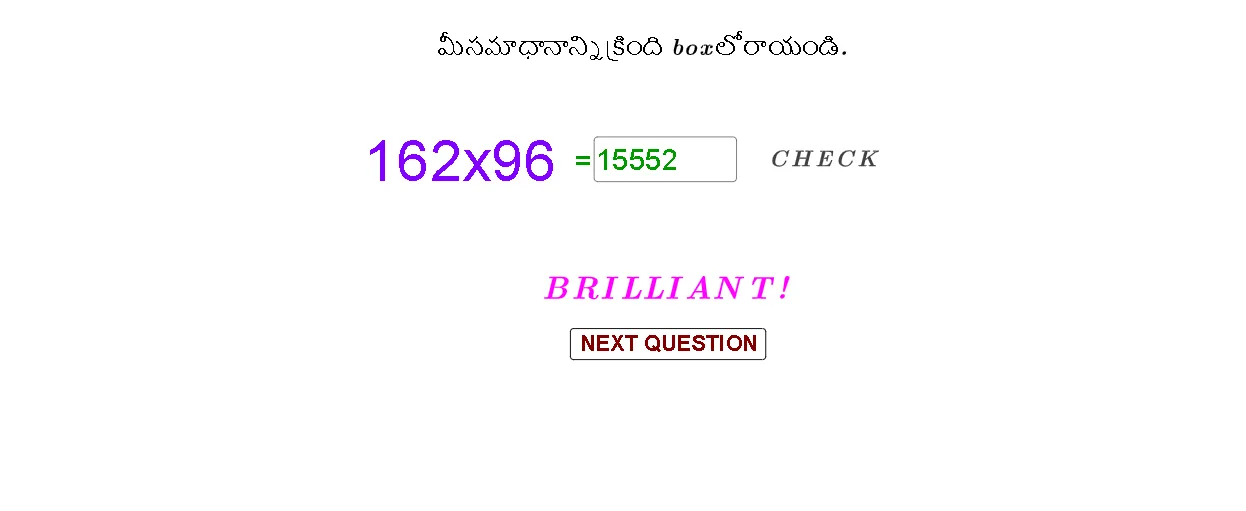
This example demonstrates how multiplication involving “3D numbers” can be visualized and linked to a “2D” display, making the operational structure more intuitive. Key concepts include arithmetic multiplication expressed in a geometric/coordinate-like visualization, interactive parameterization (so students can change inputs and observe outcomes), and function-style thinking supported by dynamic inputs and labels. Construction focuses on the GeoGebra commands shown in the construction summary: Random to generate randomized values, Textfield to display/update textual information, and InputBox1 to let users enter or adjust parameters. The example also uses multiple text objects (text1–text5) and a control button (button1), along with variables/objects such as a, b, c, and a_1 to manage the displayed state and drive the multiplication visualization. Suitable for high-school students and early university learners, especially for classroom demonstrations, interactive learning, and exploratory activities on how computations can be represented visually.
GeoGebra Commands & Parameters
Random(100, 999) → aRandom(10, 99) → bTextfield(a_1) → InputBox1
AI Drawing Prompt Reference
Create a visualization of multiplication between 3D and 2D numbers. First, generate two random numbers a and b, then allow users to adjust parameters via an input box. Use text objects to display the values of a and b, and show the multiplication result through transformations and graphs.
The prompt above was compiled from the original drawing commands and is for reference only.