
Visualizing Limits for Complex Functions
Loading the math board and drawing, please wait…
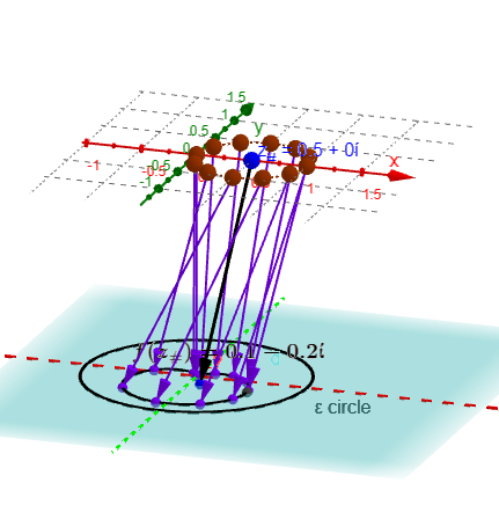
This GeoGebra example dynamically illustrates the limit of a complex function in the complex plane, showing how f(z) approaches a limit L as z tends to a point. It emphasizes the ε-δ definition of complex limits, path independence, and the behavior of function values near the limit point. The construction uses commands such as Sequence, Zip, If, Circle, Line, Vector, Point, Locus, and Textfield to create interactive ε-circles, δ-neighborhoods, and traced function-value paths. Objects include dynamic sliders for ε and δ, input boxes for parameters, and loci of f(z) along various approach paths. This is ideal for university-level complex analysis courses, helping students grasp the geometric meaning of limits in the complex domain and compare with real-variable limits. It also serves as a powerful visual aid for instructors and self-learners in advanced calculus or mathematical visualization.
GeoGebra Commands & Parameters
Sequence(0, m) → MZip(((2 * π) * k / m), k, M) → t_*Zip((δ * ℯ^((t * ί))) + z_#, t, t_*) → z_*If(e ≟ 1, z_# - fz_#, 0) → alignCircle(z_#, δ) → cZip(f(z) + align, z, z_*) → fz_*Zip((x(z), y(z), ht), z, fz_*) → fpt_*Line(O, ZY1) → YaxLine(O, ZX1) → XaxZip(Vector[A, B], A, z_*, B, fpt_*) → fvec_*Vector(z_#, Fz1_#) → vecf_#Point(c) → A0Locus(PtAF, A0) → fLocIf(e ≟ 1, (x(z_#), y(z_#), ht), (x(fz_#), y(fz_#), ht)) → Alignfz_#Vector(z_#, Alignfz_#) → uTextfield(F) → InputBox1Circle(L, ε, Vector[(0, 0, 1)]) → εcir
AI Drawing Prompt Reference
Create a dynamic 3D visualization in the complex plane showing the limit of a complex function. Place a target point with a draggable δ-neighborhood circle controlled by a slider, and sample multiple points evenly on this circle as approach paths. For each sampled point, compute the function value and draw vertical line segments connecting the input point to its output, forming traced loci along different paths. Add an ε-circle centered at the limit value with adjustable radius to check if function values fall inside. Include coordinate axes, input boxes, and draggable points for interactive parameter adjustment, emphasizing path independence and the geometric meaning of the ε-δ definition.
The prompt above was compiled from the original drawing commands and is for reference only.