
Visualizing Inverse Functions!
Loading the math board and drawing, please wait…
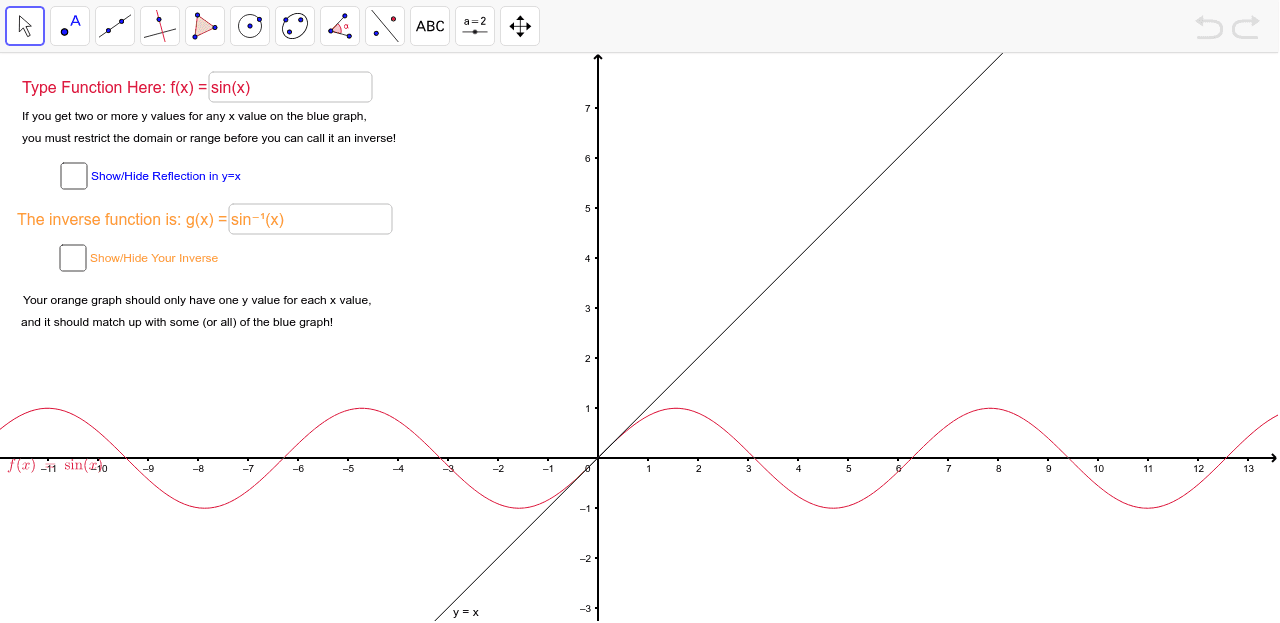
This example demonstrates how to visualize inverse functions using GeoGebra, helping students understand the geometric relationship between functions and their inverses. Key mathematical concepts include function inversion, reflection transformations, and coordinate geometry. Construction involves using Textfield and Mirror commands to create inverse function images, and inputBox1 for entering function expressions. Suitable for high school A2 mathematics courses to reinforce function concepts and graphing skills.
GeoGebra Commands & Parameters
Textfield(f) → inputBox1Textfield(g) → inputBox2Mirror(f, a) → h
AI Drawing Prompt Reference
Draw the graph of a function f(x) and its inverse function g(x). Use inputBox1 to enter the function f(x) and inputBox2 to enter the function g(x). Reflect the graph of f(x) over the line y=x to obtain the graph of the inverse function g(x).
The prompt above was compiled from the original drawing commands and is for reference only.