
Visualizing Inequation Solutions
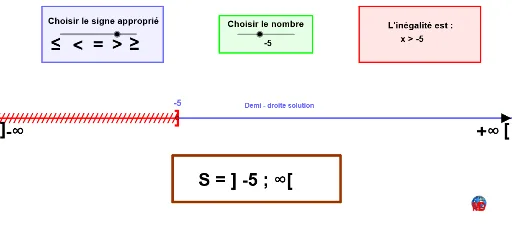
Loading the math board and drawing, please wait…
In collections
Everything you want to know about inequalities without ever
Everything you Want to Know about Inequalities (D Mentrard)
This example dynamically demonstrates how to represent the solution set of an inequality on a coordinate plane. Key math concepts include inequalities, number lines, and area representation. GeoGebra commands used in construction are Ray, Point, If, Polygon, and Sequence. Suitable for high school students learning about the geometric meaning of inequality solutions and introductory linear programming concepts.
GeoGebra Commands & Parameters
Ray(A, F) → fPoint(xAxis) → GRay(A, G) → gIf(b ≟ -2, 1, If[b ≟ -1, 1, 0]) → rep1Point(xAxis) → IPoint(xAxis) → JRay(A, J) → hPoint(xAxis) → KRay(A, K) → iIf(b ≟ 1, 1, If[b ≟ 2, 1, 0]) → rep2Polygon(M, N, O, P) → poly1, m, n, o, pPolygon(Q, R, S, T) → poly2, q, r, s, tPolygon(U, V, W, Z) → poly3, u, v, w, zSequence(A + (i, -1), i, 0, 200, 1) → liste1Sequence(A + (i + 1, 1), i, 0, 200, 1) → liste2Sequence(Segment[Element[liste1, i], Element[liste2, i]], i, 1, Length[liste2]) → liste3Sequence(A - (i, -1), i, 0, 200, 1) → liste4Sequence(A - (i + 1, 1), i, 0, 200, 1) → liste5Sequence(Segment[Element[liste4, i], Element[liste5, i]], i, 1, Length[liste4]) → liste6Polygon(B_1, D_1, C_1) → poly4, c_1, b_1, d_1Polygon(E_1, F_1, G_1, H_1) → poly5, e_1, f_1, g_1, h_1
AI Drawing Prompt Reference
Draw a coordinate plane and two rays f and g starting from point A, passing through points F and G respectively. Then draw two rays h and i starting from point A, passing through points J and K respectively. Based on the value of b, draw two regions representing the solution sets of inequalities using polygons. Finally, draw a series of parallel line segments to the x-axis, forming a grid, to illustrate the solution sets of the inequalities.
The prompt above was compiled from the original drawing commands and is for reference only.