
Visualizing Functions of Two Variables by Roman Chijner (2)
Loading the math board and drawing, please wait…
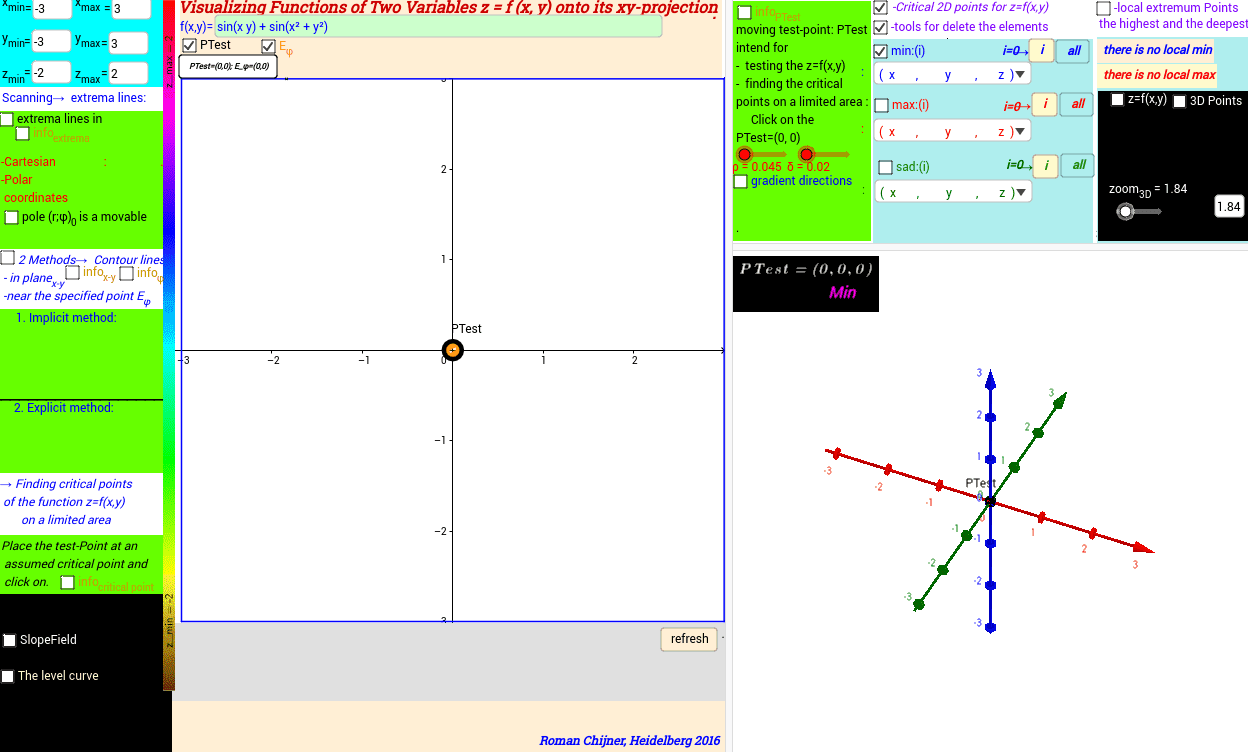
This example demonstrates how to visualize functions of two variables using GeoGebra. Core math concepts include functions, vectors, polygons, and coordinate geometry. Key constructions involve commands like Polygon, ImplicitCurve, Locus, and Vector to plot function graphs, vector fields, and trajectories; Sequence and Sum for generating sequences and summations; and Textfield, RotateText for dynamic text display. Suitable for high school and above, aiding in understanding the geometric representation of multivariate functions and vector analysis.
GeoGebra Commands & Parameters
Polygon((x_{max}, y_{max}), (x_{min}, y_{max}), (x_{min}, y_{min}), (x_{max}, y_{min})) → VV, j, t, c, dIf(b_a, Nx_a, 1) → Nx1_aPolygon((x((ro; α)), y((ro; α)), z_{min}) + PTest, (x((ro; α + 180°)), y((ro; α + 180°)), z_{min}) + PTest, (x((ro; α + 180°)), y((ro; α + 180°)), z_{max}) + PTest, (x((ro; α)), y((ro; α)), z_{max}) + PTest) → poly1, k, l, m, pImplicitCurve(f(x, y) - f(x(C), y(C))) → ICurve_2IntersectPath(plane0, f(x, y)) → ICurve_3Point(ICurve_2) → R0Length(lr2) → llr2Sequence((x(Element[lr2, i]), y(Element[lr2, i]), f(x(Element[lr2, i]), y(Element[lr2, i]))), i, 1, llr2) → lllPmin01If(Length[lllPmin01] ≟ 0, false, true) → bwllPmin01Length(lr1) → llr1Sequence((x(Element[lr1, i]), y(Element[lr1, i]), f(x(Element[lr1, i]), y(Element[lr1, i]))), i, 1, llr1) → lllPmax01If(Length[lllPmax01] ≟ 0, false, true) → bwllPmax01If(bwllPmax01, Max[z(lllPmax01)], 1000) → Maxz0If(bwllPmax01, IndexOf[Maxz0, Sequence[z(Element[lllPmax01, i]), i, 1, Length[lllPmax01]]], 1000) → Indexmaxz0If(b, true, false) → hIf(h, Nx, 1) → Nx1Length(lr3) → llr3Point(Segment[(0, 0), (6.28319, 0)]) → AfPoint(Segment[Px2, Px1]) → AxPoint(Segment[Py2, Py1]) → AyTextfield(N_{V1}) → inputBox1Textfield(x_{min}) → inputBox2Textfield(x_{max}) → inputBox3Textfield(y_{min}) → inputBox4Textfield(y_{max}) → inputBox5Textfield(f) → inputBox6Textfield(z_{min}) → inputBox7Textfield(z_{max}) → inputBox8Point(Segment[Pz2, Pz1]) → AzTextfield(ω_c) → inputBox9Textfield(vt) → inputBox10Sum(Sequence[If[f(x(PTest), y(PTest)) - f(x(Element[lr01, i]), y(Element[lr01, i])) > 0, 1, 0], i, 1, n]) → ext1RotateText("z_{min}=" + z_{min} + "", 90°) → Text2RotateText("z_{max}=" + z_{max} + "", 90°) → Text6Sequence(Segment[Element[l0maxmin2, k], Element[l0maxmin2, k + 1]], k, 1, Length[l0maxmin2]) → linelmaxmin2Sequence(Element[lr1, i], i, 1, llr1) → lPmaxSequence(Element[lr2, i], i, 1, llr2) → lPminSequence(Element[lr3, i], i, 1, llr3) → lPsadIf(bwllPmin01, Min[z(lllPmin01)], 1000) → Minz0If(bwllPmin01, IndexOf[Minz0, Sequence[z(Element[lllPmin01, i]), i, 1, Length[lllPmin01]]], 1000) → Indexminz0Element(lr2, Indexminz0) → P_{min0}If(bwllPmin01, Element[lllPmin01, Indexminz0], (1000, 1000, 1000)) → zmin2Point(Liste1) → C111aLocus(C1110a, C111a) → locPolyLine(l0maxmin1) → linelmaxmin11If(bwllPmax01, Element[lllPmax01, Indexmaxz0], (1000, 1000, 1000)) → zmax2RemoveUndefined(Sequence[If[f(x(PTest), y(PTest)) - f(x(Element[lr01, i]), y(Element[lr01, i])) > 0, i, NaN], i, 1, n]) → lr04Zip(Vector[b, a], a, Sequence[Element[lr01, Element[lr04, i]], i, 1, Length[lr04]], b, Sequence[Element[lr02, Element[lr04, i]], i, 1, Length[lr04]]) → lr06Sequence((x(Element[lr01, i]), y(Element[lr01, i]), f(x(Element[lr01, i]), y(Element[lr01, i]))), i, 1, n) → lr013Sequence((x(Element[lr02, i]), y(Element[lr02, i]), f(x(Element[lr02, i]), y(Element[lr02, i]))), i, 1, n) → lr023Zip(Vector[b, a], a, Sequence[Element[lr013, Element[lr04, i]], i, 1, Length[lr04]], b, Sequence[Element[lr023, Element[lr04, i]], i, 1, Length[lr04]]) → lr063Zip(Vector[a, b], a, Sequence[Element[lr01, Element[lr05, i]], i, 1, Length[lr05]], b, Sequence[Element[lr02, Element[lr05, i]], i, 1, Length[lr05]]) → lr07Zip(Vector[a, b], a, Sequence[Element[lr013, Element[lr05, i]], i, 1, Length[lr05]], b, Sequence[Element[lr023, Element[lr05, i]], i, 1, Length[lr05]]) → lr073Textfield(zoom_{3D}) → InputBox1Element(lr1, rmax - 1) → PzmaxElement(lr2, rmin - 1) → PzminElement(lr3, rsad - 1) → PzsadText("( x , y , z )") → TextR01Join({{TextR01}, lllPmax01}) → llPmax01Element(lr1, Indexmaxz0) → P_{max0}Sequence((x(Element[lr3, i]), y(Element[lr3, i]), f(x(Element[lr3, i]), y(Element[lr3, i]))), i, 1, llr3) → lllPspJoin({{TextR01}, lllPmin01}) → llPmin01Join({{TextR01}, lllPsp}) → llPsad01Element(lllPsp, rsad - 1) → Pzsad_{3D}Element(lllPmax01, rmax - 1) → Pzmax_{3D}Element(lllPmin01, rmin - 1) → Pzmin_{3D}Textfield(A) → InputBox2RemoveUndefined(Sequence[If[f(x(PTest), y(PTest)) - f(x(Element[lr01, i]), y(Element[lr01, i])) > 0, i, (-i)], i, 1, n]) → lr04cAppend(lr04c, Element[lr04c, 1]) → lr04ccSum(Sequence[If[(Element[lr04cc, i] * Element[lr04cc, i + 1]) < 0, 1, 0], i, 1, n + 1]) → lr04cccLine(A, RoR) → iImplicitCurve(f(x, y) - zi) → list3ImplicitCurve(f(x, y) - zii) → list4Vector(R0, R41) → w_11Vector(R0, R0 + R11) → u_11Textfield(ω0_c) → InputBox3Textfield(r_a) → InputBox5Point(c) → GPoint(j) → HPoint(w_11, 1) → IVector(F, I_{3D}) → vIf(ext1 ≟ n, 1, If[ext1 ≟ 0, 2, If[(lr04ccc > 2) ∧ (lr04ccc ≤ 4), 3, 4]]) → rooTextfield(n_c) → InputBox6Textfield(a_c) → InputBox7Textfield(r_{lc}) → InputBox8Textfield(vt) → InputBox9PolyLine(Bl) → BlyPolyLine(Gr) → GryPolyLine(Ro) → RoyTextfield(Nx) → ResolutionTextfield(r) → InputBox11Textfield(v_{m4}) → InputBox4Textfield(Nz) → InputBox10Textfield(n) → InputBox12Textfield(rr) → InputBox13Textfield(r_{ext}) → InputBox14Textfield(v_{zi}) → InputBox15Textfield(d_1) → InputBox16Textfield(f_1) → InputBox17