
Visualizing First and Second Derivatives of Functions
Loading the math board and drawing, please wait…
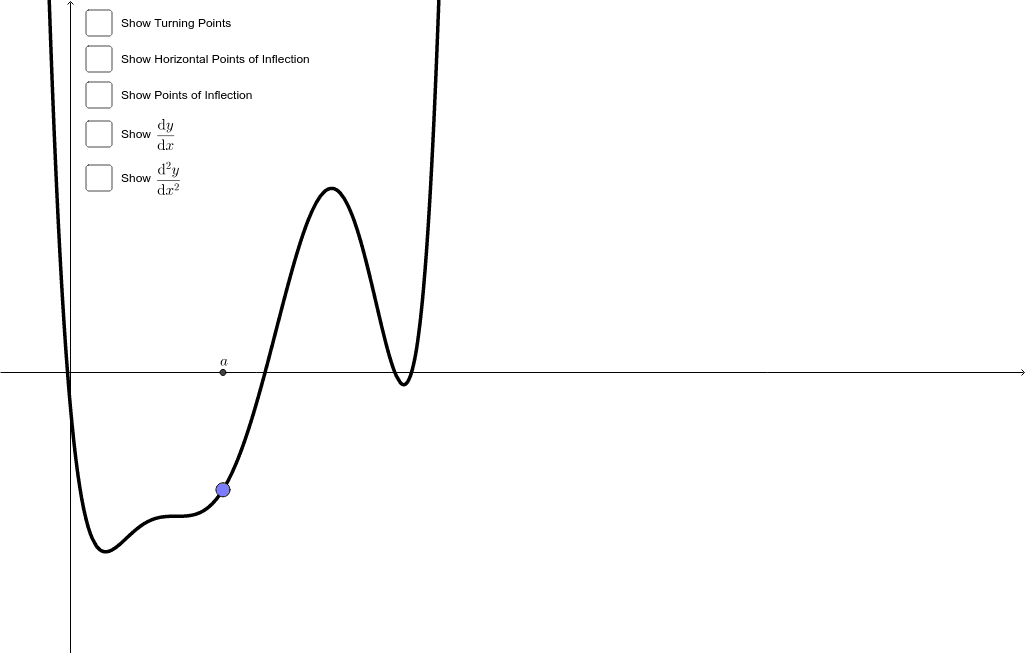
This interactive GeoGebra example demonstrates the geometric relationship between a function and its first and second derivatives. The first derivative represents the slope of tangent lines and identifies extremum points, while the second derivative reveals the function's concavity and locates inflection points. Key construction techniques include: using the Derivative command to compute f' and f''; employing Extremum and TurningPoint tools to automatically locate critical points; using the Tangent command to draw dynamic tangent lines; applying Circle and Vector to visualize tangent and normal vectors; and using Segment for line segment construction. Ideal for high school mathematics (introduction to derivatives) and college calculus (applications of derivatives) classroom demonstrations and student exploration.
GeoGebra Commands & Parameters
Derivative(f) → f'Derivative(f') → f''Point(f) → AExtremum(f) → B, C, DTurningPoint(f) → E, F, G, HTangent(A, f) → aCircle(A, 2) → cIntersect(c, a, 1) → IIntersect(c, a, 2) → JVector(A, I) → uVector(A, J) → vPoint(K, u) → MPoint(K, v) → NVector(K, N) → wVector(K, M) → bSegment(K, N) → dSlope(d) → mPoint({x(L) + (2 * cos((t * f''(x(A))))), y(L) + (2 * sin((t * f''(x(A)))))}) → OMirror(O, L) → O'Vector(L, O) → eVector(L, O') → hPoint({x(A), 0}) → P