
Visualizing Equivalent Transformations of Equations
Loading the math board and drawing, please wait…
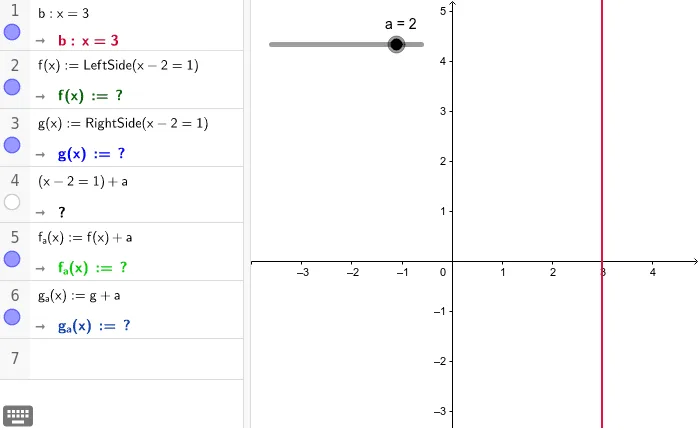
This example demonstrates how to understand equivalent transformations of equations through graphical methods. It involves core mathematical concepts such as algebra, equation transformations, geometric transformations, and division. Construction highlights include using GeoGebra commands/objects a, e, b, f, g, f_a, g_a to build and display the transformation process. Suitable for high school students learning algebra and geometric transformations.
GeoGebra Commands & Parameters
Numeric a(2)Line e(2, 0, -3)Line b(1, 0, -3)Function fFunction gFunction f_aFunction g_a
AI Drawing Prompt Reference
Draw two parallel lines, one passing through (2,0) and the other through (-3,0), and illustrate the transformation relationship between them. Define two functions f and g, along with their transformed versions f_a and g_a when a=2, and plot these function graphs in the coordinate system to highlight the correspondence between the original and transformed functions, aiding in understanding equivalent transformations of equations.
The prompt above was compiled from the original drawing commands and is for reference only.