
Visualizing Equivalent Fractions
Loading the math board and drawing, please wait…
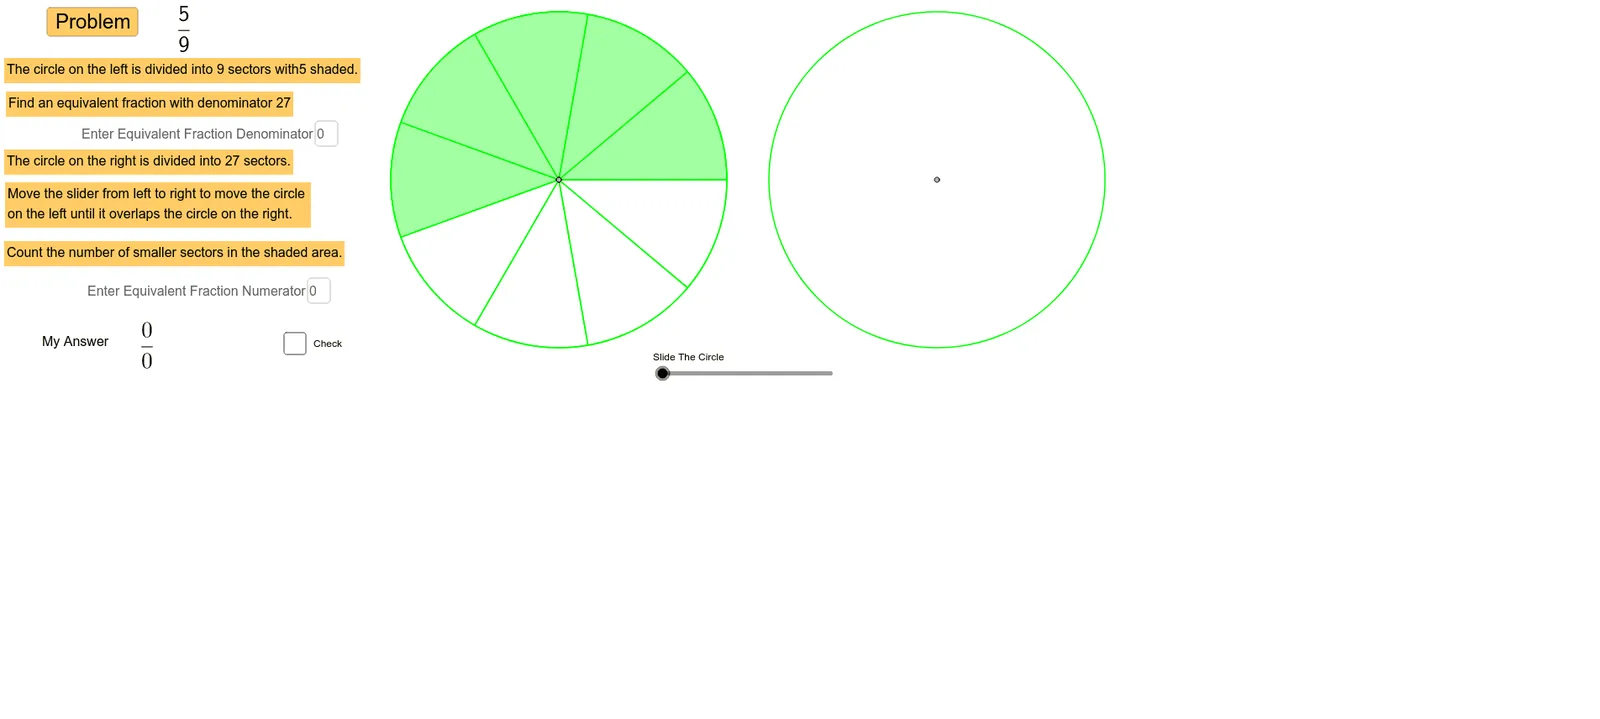
This example demonstrates the concept of equivalent fractions through dynamic visualizations. It involves core mathematical concepts like fractions, geometric representations, and greatest common divisor. Constructed using commands like Random, GCD, Point, Segment, Circle, Sequence, Sector, Textfield, Translate, and Vector. Suitable for middle school and above, helping students intuitively grasp the properties of equivalent fractions.
GeoGebra Commands & Parameters
Random(2, 12) → denom_1Random(1, denom_1 - 1) → numer_1GCD(numer_1, denom_1) → tPoint(xAxis) → BSegment(B, A) → aPoint(a) → CCircle(C, 4) → dSequence(m, m, 1, denom - 1, 1) → list3Sequence(Segment[C, C + ((4 * cos(α°)), (4 * sin(α°)))], α, 0, 360, 360 / denom) → list2Sector(d, 0, ((numer * 360) * ° / denom)) → eRandom(2, ceil(24 / denom)) → multSequence(Segment[A, A + ((4 * cos(α°)), (4 * sin(α°)))], α, 0, 360, 360 / denom_2) → list1Textfield(numer_2) → inputBox1Textfield(denom_2) → inputBox2Translate(d, Vector[B, (f, 0)]) → d'_1Vector(B, (f, 0)) → uTranslate(e, u) → e'Translate(list2, u) → list2'