
Visualizing Differentiation – Exploring Polynomial Derivatives
Loading the math board and drawing, please wait…
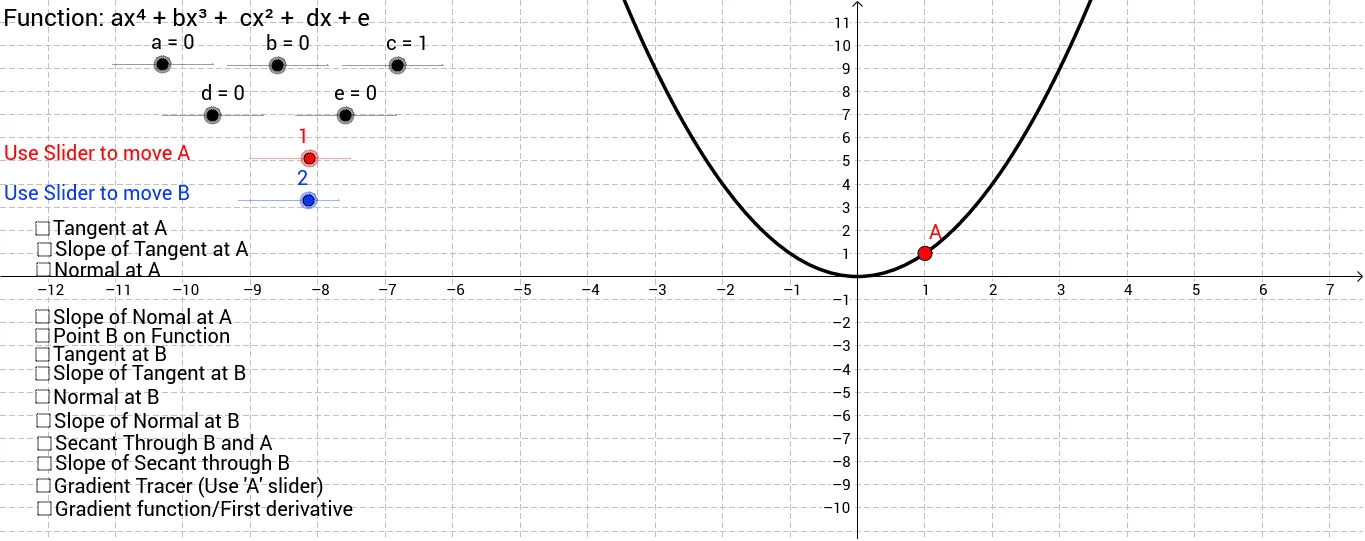
① This example visualizes the differentiation of polynomials up to the fourth order, illustrating the relationship between the original function, its derivative, and geometric interpretations such as tangent lines and slopes. ② Core mathematical concepts include differentiation from first principles, derivatives of polynomial functions, slope of tangent lines, quadratic equations, higher‑order derivatives, and the connection between algebraic and geometric representations. ③ Construction details: GeoG2 uses commands like Tangent (to draw tangent lines), Slope (to compute line slopes), Line (to create lines), Point (to define points), Segment (to display segments), OrthogonalLine (to draw perpendicular lines), and Derivative (to compute symbolic derivatives). Objects such as movA, movB (sliders for polynomial coefficients), e, a, b, c, d, e_1 (coefficients), and text objects text2, text3, text8 are employed to dynamically adjust coefficients and display results. ④ Suitable audience: high‑school and early university students learning calculus, teachers preparing lessons on differentiation, and anyone interested in interactive visualizations of mathematical concepts. It serves as an effective classroom demonstration, online tutoring tool, or self‑study resource for exploring the geometric meaning of derivatives.
GeoGebra Commands & Parameters
Tangent(A, f) → gSlope(g) → hLine(A, B) → jPoint(j) → CSegment(B, C) → kSlope(k) → lTangent(B, f) → iSlope(i) → m_2OrthogonalLine(B, i) → sPoint(s) → ESegment(E, B) → tSlope(t) → m_3OrthogonalLine(A, g) → a_1Point(a_1) → FSegment(F, A) → b_1Slope(b_1) → m_4Derivative(f) → f'
AI Drawing Prompt Reference
Please draw a graph that visualizes polynomial functions and their derivatives, including the original function, its derivative, and geometric interpretations such as tangent lines and slopes. The graph should display points of tangency, tangent lines, perpendicular segments, and their slopes. The construction sequence is roughly: draw the tangent line to the original function, compute the slope of the tangent line, draw a line connecting two points, mark a point on this line, draw a segment between these points and calculate its slope, draw a line perpendicular to the tangent line and related points and segments. Finally, compute and display the derivative of the original function.
The prompt above was compiled from the original drawing commands and is for reference only.