
Visualizing Derivatives of Inverse Relationships
Loading the math board and drawing, please wait…
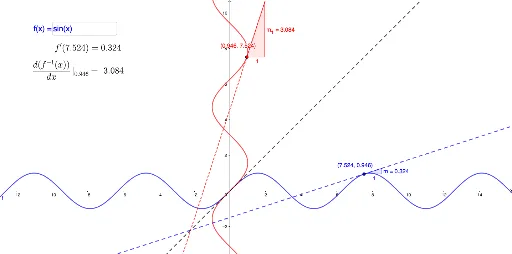
This GeoGebra example dynamically illustrates the derivative relationship between a function and its inverse. It shows that when a function f and its inverse g are symmetric about the line y=x, the slopes of their tangent lines at corresponding points are reciprocals. Core mathematical concepts include inverse functions, derivatives, tangent lines, and symmetry of graphs. The construction uses commands such as CurveCartesian to plot curves, Tangent to create tangent lines, Slope to compute slopes, and Textfield/InputBox1 for interactive parameter control. Objects include f, c, a, A, B, g, h, i, m, m_1, and text elements. This is suitable for high school to college-level calculus instruction, helping students grasp the geometric meaning of the inverse function derivative rule. It can be used for classroom demonstrations or self-directed exploration.
GeoGebra Commands & Parameters
CurveCartesian((f(t), t), t, -20, 20) → cTangent(B, c) → hTangent(A, f) → iTextfield(f) → InputBox1Slope(i) → mSlope(h) → m_1